Understanding WTI Crude Oil Technical Analysis: Navigating Signals and Outlook
Welcome, future masters of the market! Today, we’re diving deep into the fascinating world of WTI Crude Oil Futures, specifically through the lens of technical analysis. Imagine the global energy market as a vast, complex ocean, with WTI prices being the powerful currents. Technical analysis is like the sophisticated navigation system that helps us read these currents, understand their direction, and anticipate where they might lead us next.
We know you’re here to gain professional knowledge and find profitable opportunities. That’s precisely our goal – to demystify complex concepts and empower you. Currently, as we observe the WTI Crude Oil Futures market, we see the price trading around the 83.44 USD mark. This is a slight decline from its previous close, reflecting the constant movement inherent in this volatile commodity.
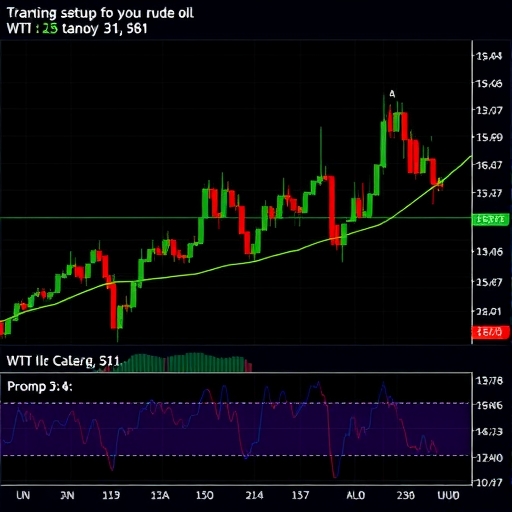
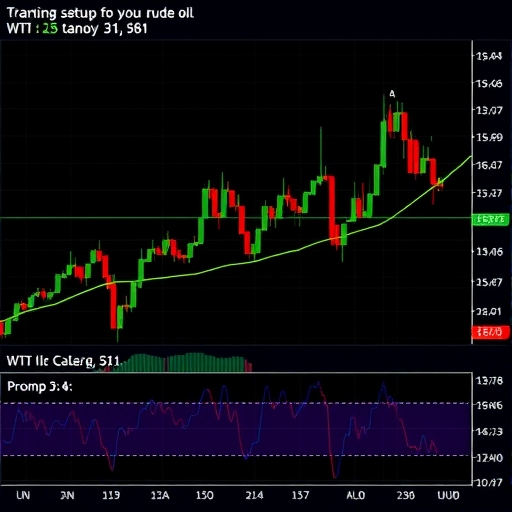
When we apply our technical tools, the overall picture emerging from the data is quite clear: the technical analysis summary signal for WTI Crude Oil Futures is currently pointing towards a Strong Sell. What exactly does this mean? It suggests that, based on the patterns and signals generated by a wide array of technical indicators and studies, the path of least resistance for WTI in the short to medium term appears to be downwards. But how do we arrive at such a strong conclusion? Let’s break down the components that contribute to this signal, just like a captain examines different instruments on their ship’s bridge.

Technical indicators are the heartbeat monitors and pressure gauges of the market. They take price and volume data and transform it into visual signals that help us understand momentum, volatility, and potential trend changes. For WTI Crude Oil, the current analysis shows a broad consensus among many key indicators, predominantly flashing ‘Sell’ signals. Let’s explore some of these crucial tools and what their current readings suggest for WTI.
| Indicator | Signal | Interpretation |
|---|---|---|
| Relative Strength Index (RSI) | Sell | Indicates bearish momentum, with downward movements stronger than upward movements. |
| Moving Average Convergence Divergence (MACD) | Sell | Suggests weakening upward momentum with increasing downward pressure. |
| Commodity Channel Index (CCI) | Sell | Confirms price weakness compared to its recent historical average price. |
Consider the Relative Strength Index (RSI), a popular momentum oscillator. It measures the speed and change of price movements. Typically, a reading below 50 suggests bearish momentum. When the RSI signals ‘Sell’ for WTI, it indicates that the downward price movements are currently stronger or happening at a faster pace than upward movements. What does this tell you about the current selling pressure on WTI?
Another critical tool is the Moving Average Convergence Divergence (MACD). This trend-following momentum indicator shows the relationship between two moving averages of a security’s price. A ‘Sell’ signal from the MACD often occurs when the MACD line crosses below the signal line, suggesting weakening upward momentum and increasing downward pressure. When the MACD aligns with a ‘Sell’ signal for WTI, it reinforces the idea that the short-term trend is turning bearish or strengthening its bearish trajectory.
The Commodity Channel Index (CCI) is another versatile oscillator that measures the current price relation to a historical average price. Readings typically fluctuate between +100 and -100. A ‘Sell’ signal often arises when the CCI moves below +100 or below the 0 line, suggesting the price is deviating significantly below its average. For WTI, a ‘Sell’ signal here confirms that the price is relatively weak compared to its recent historical price action.
Beyond these, other indicators like the Rate of Change (ROC), Ultimate Oscillator, and Bull/Bear Power are also contributing to the bearish outlook. These tools, each with their unique method of analyzing price data, are largely echoing the same sentiment for WTI: the technical forces are currently skewed towards the downside. While some indicators, like the STOCHRSI and Williams %R, might be showing ‘Oversold’ conditions – suggesting a potential for a bounce or pause in the decline – the sheer number of ‘Sell’ signals across the board gives significant weight to the overall ‘Strong Sell’ summary.
What happens when so many different technical lenses focus on the same conclusion? It strengthens the conviction behind the signal. It’s like multiple compasses all pointing north; you become more confident in your direction. However, remember that even strong signals are not guarantees, merely probabilities based on historical patterns.
Volatility and Strength: Understanding ATR and ADX for WTI Trading
In addition to momentum and trend direction, understanding volatility and trend strength is crucial when trading a dynamic commodity like WTI Crude Oil. This is where indicators like the Average True Range (ATR) and the Average Directional Index (ADX) come into play. They don’t necessarily give explicit ‘Buy’ or ‘Sell’ signals in the same way oscillators do, but they provide essential context for interpreting other signals and managing risk.
The Average True Range (ATR) measures market volatility by calculating the average range between high, low, and closing prices over a specific period (commonly 14 days). It tells us how much the price of WTI is typically moving within a given timeframe. A higher ATR suggests greater volatility, meaning price swings are larger, potentially offering bigger profit opportunities but also carrying higher risk. Conversely, a lower ATR indicates consolidation or lower volatility. Understanding the current ATR for WTI is vital for setting appropriate stop-loss orders and profit targets, ensuring your trade sizes are proportional to the expected price swings.
The Average Directional Index (ADX), on the other hand, measures the *strength* of a trend, not its direction. It typically ranges from 0 to 100. Readings above 20 or 25 often indicate a trending market (either up or down), while readings below suggest a non-trending or consolidating market. The ADX is often accompanied by the Positive Directional Indicator (+DI) and the Negative Directional Indicator (-DI), which help identify the trend’s direction. If the ADX is high and the -DI is above the +DI for WTI, it suggests a strong *downward* trend is in place, reinforcing the ‘Sell’ signals from other indicators. If the ADX is low despite many ‘Sell’ signals, it might imply the selling pressure is present but lacks strong conviction or is in a choppy, weak downtrend phase.
By incorporating the insights from ATR and ADX, we gain a more complete picture of the WTI market. The technical indicators are telling us *where* the price is likely headed (down), while ATR tells us *how much* it might move, and ADX tells us *how strong* that directional movement is likely to be. This multi-faceted approach enhances our understanding and helps us manage the inherent risks of trading WTI.
Navigating Trends with Moving Averages on WTI Charts
Moving Averages (MAs) are fundamental tools in technical analysis, acting like smoothed lines that follow the price action and help identify the underlying trend by filtering out short-term noise. They calculate the average price of a security over a specific period, and their signals are typically generated by the price crossing the average, or by different moving averages crossing each other.
We primarily look at two types: Simple Moving Averages (SMA) and Exponential Moving Averages (EMA). SMAs give equal weight to each price point in the calculation period, while EMAs give more weight to recent prices, making them react faster to new information. For WTI, both types are often used across various timeframes.
The data indicates that the shorter-term Moving Averages for WTI, typically ranging from the MA5 (5-period) up to the MA50 (50-period), are predominantly signaling ‘Sell’. This occurs when the current WTI price is trading below these moving averages, or when shorter-period MAs cross below longer-period MAs (bearish crossover). This widespread bearish signal across multiple short and medium-term MAs strongly reinforces the current downward pressure on WTI prices.
What do these short-term MA ‘Sell’ signals mean? They suggest that the average price over recent periods (5, 10, 20, 50 days or other periods depending on the chart) is now higher than the current market price. This is a classic sign of a downtrend or a significant price decline underway.
Short-Term vs. Long-Term MA Signals: What the WTI Data Tells Us
While the short-term moving averages painting a clear bearish picture for WTI, the analysis reveals a fascinating contrast when we look at the longer-term averages, specifically the MA100 (100-period) and MA200 (200-period). These longer-term MAs are currently signaling ‘Buy’.
A ‘Buy’ signal from a long-term moving average like the MA200 typically means the current WTI price is trading above this average, which represents the average price over the past 200 periods. Being above such a long-term average is often interpreted as a sign that, despite recent weakness, the overarching, larger trend might still be considered bullish, or at least not decisively bearish from a very long-term perspective. This 200-period moving average is often referred to as a significant benchmark for identifying major trends.
So, what do we make of this divergence? Short-term MAs say ‘Sell’, long-term MAs say ‘Buy’. This isn’t uncommon in markets that have recently experienced a significant decline after being in a longer-term uptrend. It suggests that while the immediate price momentum is down, potentially forming a correction or a new short-term downtrend, the foundational support from the larger, established trend (represented by the MA100 and MA200) has not yet been fully broken. This conflict between short-term weakness and long-term strength means we need to be cautious. It indicates that while selling might be favored based on recent action, there’s potential for support to emerge if the price reaches these longer-term averages.
The overall Moving Average summary signal for WTI, based on the cumulative signals from all periods, is a ‘Sell’. This is because the sheer number and significance of the short and medium-term ‘Sell’ signals currently outweigh the longer-term ‘Buy’ signals in the overall summary calculation. It emphasizes that the immediate pressure is downwards, even if the longest-term outlook isn’t definitively bearish yet. Understanding this nuanced view from the moving averages is key to avoiding premature conclusions based solely on one set of indicators.
If you’re looking to apply this kind of technical analysis to trading WTI or other commodities and currencies, choosing a robust trading platform is essential. It needs to provide accurate, real-time data and the necessary tools for charting and execution. If you’re considering starting foreign exchange trading or exploring more CFD instruments, then Moneta Markets is a platform worth considering. It originates from Australia and offers over 1000 financial instruments, suitable for both beginners and professional traders.
Pinpointing Key WTI Levels: The Power of Pivot Points
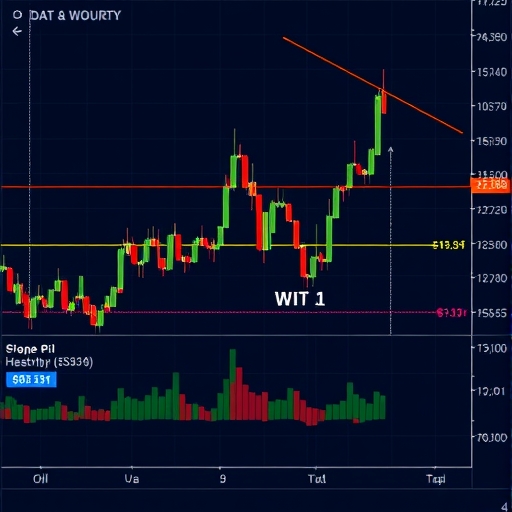
Technical analysis isn’t just about identifying trends and momentum; it’s also about pinpointing potential turning points and price targets. This is where Pivot Points become invaluable. Pivot points are calculated based on the high, low, and closing prices from the previous trading period. They are used by traders to predict potential support and resistance levels for the current trading period.
The central pivot point (often labeled simply ‘Pivot’) acts as a benchmark. If the price is trading above the pivot point, it’s generally seen as bullish; if below, it’s bearish. The derived support levels (S1, S2, S3) are prices where buying interest is expected to be strong enough to potentially halt a decline, while resistance levels (R1, R2, R3) are prices where selling pressure is expected to be strong enough to potentially cap a rally. Think of them as invisible barriers or floors that the WTI price might interact with during the trading day.

While the basic concept of pivot points is straightforward, several different methodologies exist for calculating these levels, each offering a slightly different perspective based on how they weight or utilize the previous period’s data. The most common methods include:
- Classic Pivot Points: The traditional method, widely used and based on a simple average of the previous high, low, and close.
- Fibonacci Pivot Points: These incorporate Fibonacci ratios (like 38.2%, 61.8%) applied to the range between the previous high and low, adding a layer often found in other forms of technical analysis.
- Camarilla Pivot Points: Designed to be more sensitive to recent price action, these levels are often closer to the previous close and are popular with intraday traders looking for potential reversals within a tight range.
- Woodie’s Pivot Points: This method places more emphasis on the previous closing price compared to the high and low.
- DeMark’s Pivot Points: This unique method uses different calculations depending on the relationship between the previous close and open, focusing on identifying potential turning points based on recent extremes.
Each method provides its own set of S1, S2, S3 (support) and R1, R2, R3 (resistance) levels. While they might produce slightly different numbers, experienced WTI traders often look for confluence – where levels from different methods cluster around the same price area – as this can indicate particularly strong support or resistance zones. Knowing these levels is particularly important when the overall technical picture, like the ‘Strong Sell’ signal for WTI, suggests a directional bias. These pivot points become potential targets for bearish moves (support levels) or crucial hurdles that must be overcome for the price to recover (resistance levels).
For traders utilizing technical analysis on a trading platform, having these pivot points automatically plotted or easily calculable is a significant advantage. The quality of the platform can truly impact your ability to execute analysis effectively. In choosing a trading platform, Moneta Markets‘ flexibility and technological advantages are worth mentioning. It supports mainstream platforms such as MT4, MT5, and Pro Trader, combining high-speed execution with low spread settings to provide a good trading experience.
Reading Recent WTI Price Action: Contextualizing the Technicals
While technical indicators and pivot points provide a quantitative view, understanding the recent narrative of price movement adds crucial qualitative context. The analysis notes that WTI price action has been fluctuating recently. What does this tell us? It means the market hasn’t been moving in a straight line, but rather experiencing ups and downs, testing different levels, and perhaps lacking clear, sustained momentum in either direction over very short periods.
Recent commentary highlights attempts by WTI to recover or test resistance levels. This indicates that buyers have tried to step in at times, pushing the price upwards, but have ultimately failed to sustain the rallies, leading back to the current bearish technical posture. This failure to break above key resistance reinforces the dominance of selling pressure, which aligns perfectly with the ‘Strong Sell’ signal we discussed earlier.
External factors can also play a significant role in commodities like WTI. Although the provided data only briefly touches upon this, mentioning factors like Middle East supply concerns in a historical context is important. Geopolitical events and supply/demand dynamics are fundamental drivers for crude oil prices. While technical analysis focuses on price patterns, it’s crucial to remember that these patterns are often reactions to underlying fundamental forces. A strong technical signal like ‘Strong Sell’ gains more credibility if it aligns with a deteriorating fundamental outlook or negative market sentiment driven by such external factors.
Considering this recent price behavior, the current technical picture makes sense. The ‘Strong Sell’ signal isn’t necessarily predicting a sudden collapse, but rather reflecting the market’s struggle to hold onto gains, its repeated failure at resistance, and the prevailing sentiment leaning towards further downside based on the current technical structure. It’s a picture of technical weakness being confirmed by recent trading activity.
Synthesizing the WTI Technical Picture: Why the ‘Strong Sell’ Signal?
Let’s bring together everything we’ve discussed. The ‘Strong Sell’ signal for WTI Crude Oil Futures is a conclusion drawn from the collective evidence presented by a suite of technical tools. It’s not based on a single indicator but on the harmonious (or perhaps discordant, depending on your perspective!) alignment of multiple signals.
Here’s a summary of the technical confluence leading to this ‘Strong Sell’ outlook:
- Indicators Overwhelmingly Bearish: A significant majority of key momentum and trend indicators (RSI, MACD, CCI, etc.) are currently generating ‘Sell’ signals. This broad consensus across different types of oscillators and indicators points to pervasive selling pressure and downward momentum in WTI.
- Short-Term Moving Averages Confirm Weakness: The price of WTI is trading below its key short and medium-term moving averages (MA5 through MA50). These lines, which smooth recent price action, are all pointing downwards or acting as resistance, confirming that the immediate trend is bearish.
- Failure at Resistance: Although not a direct indicator signal, the commentary on recent price action suggests WTI has struggled to overcome resistance levels, indicating buying power is currently insufficient to reverse the decline. This aligns with the bearish technical signals.
- Pivot Points as Potential Targets/Barriers: The calculated pivot points provide specific price levels that traders will be watching. Given the ‘Strong Sell’ signal, the support levels (S1, S2, S3) derived from these methods become potential downside targets, while the resistance levels (R1, R2, R3) highlight the significant hurdles the price would need to clear to invalidate the bearish outlook.
While the long-term moving averages (MA100, MA200) still signal ‘Buy’, indicating potential underlying long-term support, the immediate and medium-term technical evidence strongly favors the downside. The ‘Strong Sell’ signal is a powerful warning flag for bulls and a potential opportunity for bears, suggesting that based on historical price behavior patterns, further declines in WTI are more likely than a sustained rally at this point.

Applying WTI Technical Analysis: Trading Strategies and Risk Management
Now that we understand the technical picture pointing to a ‘Strong Sell’ for WTI, how can traders potentially utilize this information? Remember, technical analysis is a tool to help inform decisions, not predict the future with certainty. A ‘Strong Sell’ signal doesn’t mean you must sell, but it alerts you to the prevailing technical bias.
For those inclined to trade with the technical trend, a ‘Strong Sell’ signal might suggest considering short positions (selling WTI futures or a related CFD, hoping the price will fall). Entry points might be sought near resistance levels identified by pivot points or moving averages, or on a clear breakdown below key support. Stop-loss orders would be crucial, placed above resistance levels or recent highs to limit potential losses if the price moves unexpectedly upwards. Profit targets could be set at lower support levels derived from pivot points or previous significant lows.
Conversely, for traders looking for potential reversals or buying opportunities against the prevailing technical trend, a ‘Strong Sell’ signal means exercising extreme caution. They might wait for signs of the selling pressure exhausting itself, perhaps indicated by ‘Oversold’ conditions on oscillators leading to bullish divergences, or a strong bullish price action breaking above significant resistance levels (like pivot points or moving averages) before considering a buy. Even then, tighter stop-losses and smaller position sizes might be prudent.
Effective risk management is paramount, especially when trading a volatile instrument like WTI. Position sizing should always be based on your risk tolerance and the potential volatility (as measured by ATR). Never risk more capital on a single trade than you can afford to lose. The ‘Strong Sell’ signal provides a directional bias, but the levels derived from pivot points and moving averages are equally important for defining risk parameters (stops) and potential rewards (targets).
Conclusion: Navigating the WTI Outlook with Technical Insight
So, where does this leave us in the WTI Crude Oil market? Our journey through the technical landscape reveals a clear consensus among various indicators and short-term moving averages, culminating in an overall Strong Sell technical signal for WTI Crude Oil Futures. This powerful signal is driven by bearish momentum, trend weakness in shorter timeframes, and recent price action that has failed to sustain upward moves, instead succumbing to selling pressure.
We’ve seen how technical indicators like RSI and MACD are flashing red, how short-term MAs are tracking below the current price, and how different pivot point methods provide crucial reference points – potential floors at support levels (S1, S2, S3) and ceilings at resistance levels (R1, R2, R3) – for where price action might unfold following this bearish signal. While the longer-term MA100 and MA200 still show a bullish bias, indicating that a complete paradigm shift from a long-term perspective hasn’t occurred, the immediate technical headwinds for WTI are significant.
As traders and investors, our role is to interpret these signals and decide how to integrate them into our own strategies. The ‘Strong Sell’ signal suggests that favoring the downside, or at least being very cautious about bullish positions, is the technically favored approach based on the current data. Remember to keep a close watch on those pivot point levels – they are where the market might pause, reverse, or accelerate. Always combine technical analysis with sound risk management principles and consider the broader fundamental context, as market dynamics can shift rapidly.
Technical analysis, while a powerful tool, is not a crystal ball. It provides probabilities based on historical price patterns. Always conduct your own thorough research and analysis before making any trading decisions. By diligently applying the principles of technical analysis, understanding what the indicators and levels are telling you, and managing your risk effectively, you can navigate the currents of the WTI market with greater confidence and work towards mastering your trading journey.
Navigating the complexities of global markets like crude oil requires reliable tools and a platform that supports your analytical needs. If you are seeking a foreign exchange broker that is regulated and capable of global trading, Moneta Markets holds multiple international regulatory certifications such as FSCA, ASIC, and FSA, and provides a comprehensive package including segregated client funds, free VPS, and 24/7 Chinese customer support, making it a preferred choice for many traders.
wti technical analysisFAQ
Q:What factors contribute to a ‘Strong Sell’ signal in WTI Crude Oil?
A:A ‘Strong Sell’ signal is influenced by bearish indicators such as RSI, MACD, and short-term moving averages indicating downward momentum.
Q:How can traders utilize pivot points in their analysis?
A:Pivot points help identify support and resistance levels, providing price targets for bearish moves and hurdles for bullish reversals.
Q:What is the importance of risk management while trading WTI?
A:Effective risk management is crucial to protect against losses, particularly in volatile markets like WTI, by using stop-loss orders and position sizing based on risk tolerance.
