
Welcome to our exploration of a fundamental concept in financial markets: deviation. In the dynamic world of Forex trading, prices are constantly fluctuating, driven by a multitude of factors. How do we make sense of this ceaseless movement? How do we quantify how much a currency pair’s price is truly changing, not just tick by tick, but over a meaningful period? This is where the concept of deviation becomes incredibly valuable.
Think of deviation as a way to measure the ‘stretch’ or ‘swing’ in prices. If a price stays very close to its average over time, we’d say it has low deviation. If it bounces wildly above and below its average, it has high deviation. For Forex traders, understanding this measure is key to grasping market volatility and making more informed decisions.
In this guide, we’ll delve deep into what deviation means in the context of currency trading. We’ll uncover its importance, explore the tools we use to measure it, and discuss how you can apply this knowledge to refine your trading strategies and bolster your risk management. Are you ready to add a powerful statistical lens to your view of the Forex market?
Some important points to note about deviation in Forex include:
- Deviation helps traders measure market volatility.
- Understanding deviation aids in effective risk management.
- Traders use deviation to inform their strategy based on market conditions.
What Exactly is Deviation? Defining the Core Concept
At its heart, deviation in Forex is a measure of the difference between a currency pair’s current price and its average price over a specific historical period. Imagine you’re tracking the EUR/USD pair over the last 50 periods (perhaps 50 days or 50 hours). You calculate the average closing price for those 50 periods. Deviation tells you how far away the price in any given period is from that calculated average.
Why is this difference important? Because it quantifies how much price movements are diverging from the norm, or the mean. A small deviation means prices are clustering tightly around their average, indicating stability or consolidation. A large deviation means prices are spread out widely from the average, signaling significant movement and potentially high volatility.
Consider it like measuring the consistency of a baseball pitcher. A pitcher with low deviation in their throw speeds consistently hits their target speed. A pitcher with high deviation has speeds that vary wildly – some very fast, some very slow. In Forex, high price deviation equates to a ‘wild’ market, while low deviation signifies a ‘consistent’ or quiet market.
While the term ‘deviation’ itself is a general concept, in statistical analysis, we often use specific calculations to provide a standardized measure. The most prominent and widely used measure of deviation in finance, including Forex, is standard deviation. Let’s turn our attention to this critical statistic.
Standard Deviation: The Key to Quantifying Forex Volatility
Standard deviation is the go-to statistical tool for quantifying deviation and, crucially, for measuring market volatility. It provides a single number that summarizes how much the individual data points (like closing prices) in a dataset typically differ from the mean (average) of that dataset. In Forex, the dataset is usually a series of historical prices for a currency pair over a chosen number of periods.
The calculation of standard deviation involves several steps:
- First, calculate the mean (average) of the prices over the chosen period.
- Second, find the difference between each individual price and the calculated mean.
- Third, square each of these differences (to make them positive and emphasize larger deviations).
- Fourth, calculate the average of these squared differences (this is called the variance).
- Fifth, take the square root of the variance. This final result is the standard deviation.
While the manual calculation isn’t something most traders do regularly thanks to trading software, understanding what it represents is vital. A higher standard deviation number means the prices in your dataset were, on average, further away from the mean. This translates directly to higher volatility – larger price swings and potentially faster price changes.
Conversely, a lower standard deviation number means the prices were, on average, closer to the mean. This indicates lower volatility – smaller price swings and potentially slower, more stable price action, often seen during periods of consolidation or ranging markets.
Standard deviation is particularly powerful because it uses the concept of variance to provide a normalized measure. It allows us to compare the volatility of different currency pairs, or the volatility of the same pair at different times, using a consistent metric. It gives us a concrete number to understand the typical range of price fluctuation.
As you navigate the Forex market, constantly seeking ways to improve your analysis, understanding how standard deviation quantifies price dispersion around the mean is fundamental. This measurement of volatility is not just theoretical; it has profound practical implications for your trading decisions.
| Step | Description |
|---|---|
| 1 | Calculate the mean price. |
| 2 | Find the difference from the mean. |
| 3 | Square the differences. |
| 4 | Calculate the variance. |
| 5 | Take the square root to find standard deviation. |
Why Deviation Matters: Its Critical Role in Your Trading
Now that we understand what deviation, and specifically standard deviation, measures, let’s discuss why this concept is so critical for you as a Forex trader. Why should you care about how far prices are straying from their average?
Firstly, deviation is your direct window into market volatility. Volatility is arguably one of the most important factors in trading. High volatility means opportunity for larger moves, but also higher risk. Low volatility means less potential for quick profits, but potentially lower risk in terms of sudden adverse moves. Understanding the current level of volatility, as indicated by deviation, allows you to adapt your trading style and expectations.
- Are you a breakout trader who thrives on large, fast moves? High deviation environments might suit you.
- Are you a range trader who prefers prices bouncing predictably between levels? Low deviation environments might be more comfortable.
Knowing the volatility level, indicated by deviation, helps you choose the right strategy for the current market condition.
Secondly, deviation helps you identify potential trend changes or continuations. While standard deviation itself doesn’t tell you the *direction* of the price move, changes in its value can signal shifts. A sudden increase in deviation after a period of low volatility might indicate a potential breakout from a range and the start of a new trend. A decrease in deviation during a strong trend might suggest the trend is losing momentum and consolidation or a reversal could be near.
Thirdly, and perhaps most critically, understanding deviation is fundamental to effective risk management. How wide should your stop-loss be? Where should you place your take-profit target? These decisions should be informed by how much the price is typically expected to move. In a high-deviation environment, prices swing more. Setting a tight stop-loss based on low-deviation assumptions will likely result in being stopped out prematurely by normal market noise. Conversely, in a low-deviation market, using excessively wide stops is inefficient and exposes you to unnecessary risk.
Deviation helps you set appropriate risk parameters by giving you a statistical measure of expected price fluctuation. It informs position sizing as well; higher volatility often necessitates smaller position sizes to maintain the same dollar risk exposure.
Understanding deviation is not just about looking at charts; it’s about gaining a deeper statistical understanding of market behavior, which directly translates into smarter trading decisions and more robust risk control. If you’re looking for a globally accessible Forex broker with strong regulatory oversight, Moneta Markets holds multi-jurisdictional licenses including FSCA, ASIC, and FSA. They offer comprehensive support like segregated client funds, free VPS, and 24/7 customer service, making them a top choice for many traders.
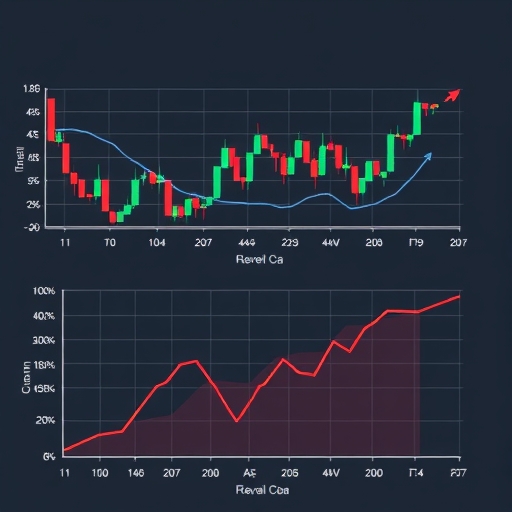
To visually represent the price fluctuations in the Forex market, consider this illustration:
Tools of the Trade: The Standard Deviation Indicator
While standard deviation is a statistical concept applicable in many fields, there is also a specific technical indicator on trading platforms simply called the Standard Deviation Indicator. This indicator typically appears in a separate window below the price chart.
The Standard Deviation Indicator plots a line representing the standard deviation of the price over a specified lookback period (e.g., 20 periods). The period setting determines the length of the historical data used for the calculation. A shorter period makes the indicator more sensitive to recent price changes, while a longer period smooths out the fluctuations but reacts more slowly.
How do we interpret the Standard Deviation Indicator?
- Rising Line: When the indicator line is rising, it means the standard deviation is increasing. This tells you volatility is increasing. Prices are becoming more dispersed from their average, indicating larger swings. This can happen during breakouts or strong trending moves.
- Falling Line: When the indicator line is falling, it means the standard deviation is decreasing. This tells you volatility is decreasing. Prices are becoming less dispersed and clustering closer to their average, indicating smaller swings and potentially consolidation or ranging behavior.
- High Values: High readings on the indicator correspond to periods of high volatility. These often occur during significant news events or strong, directional price moves.
- Low Values: Low readings correspond to periods of low volatility. These often occur during consolidation phases, holiday periods, or when traders are waiting for a major catalyst.
The Standard Deviation Indicator is often used to anticipate potential changes in market dynamics. Extremely low readings can sometimes precede a significant move (as volatility tends to expand after contracting). Conversely, extremely high readings might suggest volatility is peaking and could soon contract (though this is not a precise timing tool).
It’s important to note that the Standard Deviation Indicator is a lagging indicator. It is calculated based on historical price data and reflects past volatility. However, changes in its slope and level can offer valuable insights into the current state and potential future shifts in market behavior based on historical patterns.
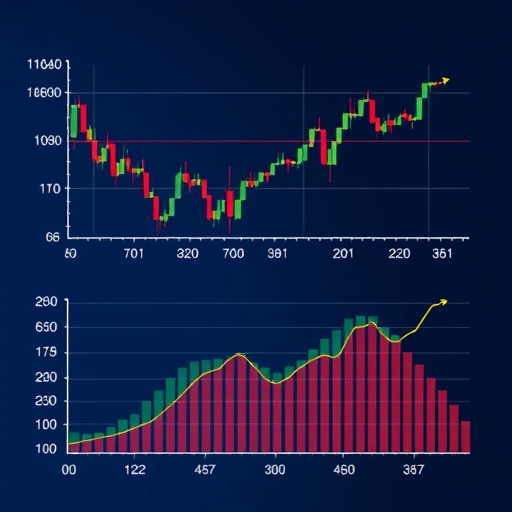
To illustrate the concept of standard deviation in trading, here’s a representation of standard deviation and its significance:
Bollinger Bands: Visualizing Deviation and Trading Signals
One of the most popular and visually intuitive technical indicators that directly utilizes standard deviation is Bollinger Bands. Developed by John Bollinger, these bands consist of three lines overlaid on the price chart:
- Middle Band: This is typically a simple moving average of the price (commonly 20 periods).
- Upper Band: This is the Middle Band plus a certain number of standard deviations (commonly 2 standard deviations).
- Lower Band: This is the Middle Band minus the same number of standard deviations (commonly 2 standard deviations).
The width of the Bollinger Bands is directly determined by the standard deviation of the price over the lookback period. When volatility (standard deviation) is high, the bands expand, moving further away from the moving average. When volatility is low, the bands contract, moving closer to the moving average. This visual representation of volatility, expanding and contracting with market conditions, is a key feature of Bollinger Bands.
How are Bollinger Bands used by traders?
- Volatility Measurement: The most direct use is seeing volatility levels visually. Wide bands = high volatility. Narrow bands = low volatility (“Bollinger Band Squeeze”).
- Range Identification: During low volatility, prices tend to stay within the narrow bands, indicating a potential ranging market.
- Potential Reversal Signals: Prices reaching or piercing the outer bands (upper or lower) can indicate that the price has moved significantly relative to its recent average and volatility. This is often interpreted as potentially overbought (near upper band) or oversold (near lower band) conditions, though this should be confirmed with other indicators.
- Breakout Signals: A “Bollinger Band Squeeze” (bands contracting tightly) often precedes a period of increased volatility and a potential breakout. When the price breaks decisively out of the tight bands, it can signal the start of a strong move.
- Trend Following: During a strong uptrend, prices will often ride along the upper band. During a strong downtrend, they may ride along the lower band. Pullbacks towards the middle band can offer potential entry points.
Bollinger Bands effectively translate the statistical concept of standard deviation into a practical, visual tool right on your price chart, helping you assess current volatility and identify potential trading opportunities based on price relative to its recent average and typical deviation.
Conclusion: Harnessing Deviation for Informed Trading
In summary, deviation, most commonly measured by standard deviation, is a powerful and indispensable concept for anyone trading Forex. It provides a statistical backbone for understanding and quantifying market volatility – how much prices are swinging relative to their historical average.
By utilizing technical indicators like the Standard Deviation Indicator and Bollinger Bands, which directly incorporate this measure, you gain crucial insights into market dynamics. These tools help you visualize volatility, identify periods of contraction and expansion, spot potential overextended price moves relative to the mean, and even glean clues about market psychology when analyzed alongside price action.
Furthermore, integrating deviation analysis is fundamental to effective risk management. It guides you in setting more appropriate stop-loss and take-profit levels, helping you size your positions correctly for the prevailing volatility. Understanding deviation allows you to adapt your trading strategies, whether you prefer navigating high-momentum breakouts or exploiting range-bound opportunities.
While no tool is perfect, and standard deviation has limitations – it doesn’t predict direction and is influenced by outliers – its value in quantifying volatility is undeniable. By combining deviation analysis with other technical indicators, price action, and fundamental analysis, you build a more robust and comprehensive understanding of the market. This layered approach is key to making more informed, confident trading decisions and navigating the complexities of Forex with greater skill and discipline. Keep learning, keep analyzing, and let the power of statistical concepts like deviation enhance your journey towards becoming a more successful trader.
what is deviation in forexFAQ
Q:What is deviation in Forex trading?
A:Deviation in Forex refers to the measure of how much a currency pair’s price fluctuates from its average price over a certain historical period.
Q:Why is standard deviation important in Forex?
A:Standard deviation is crucial as it quantifies market volatility, helping traders make informed decisions based on price movements.
Q:How can traders use deviation in their strategies?
A:Traders can use deviation to determine optimal stop-loss levels, identify market conditions, and gauge potential trend changes.