Navigating Global Markets: Understanding the Power of the Underlying Index
Welcome, fellow navigators of the financial seas. Today, we embark on a journey to understand the complex tapestry of global markets, focusing on a concept fundamental to modern investing and trading: the underlying index. Think of an index not just as a number you see flash across your screen, but as a sophisticated barometer, measuring the health, mood, and direction of specific market segments or entire economies. These benchmarks are indispensable tools for tracking market performance, assessing portfolio health, and creating investable products. Without a solid grasp of what indexes are and how they function as underlying foundations, much of the market’s movement and opportunity remains opaque. Let’s demystify this crucial concept together.
In recent market activity, we observed a fascinating mix of performance across the globe. The major U.S. stock indexes closed with varied results – the S&P 500 and Nasdaq Composite saw positive momentum, indicating strength in large-cap and technology sectors, while the Russell 2000, often seen as a gauge for smaller companies, experienced a decline. This divergence itself tells us something about the market’s focus and risk appetite. Meanwhile, markets in Europe and parts of Asia posted gains, though others, like Indonesia’s IDX Composite and Brazil’s IBOVESPA, saw losses. These movements, while seemingly disparate, are all captured and communicated through the lens of their respective underlying indexes.
Key points to consider regarding underlying indexes include:
- They serve as critical benchmarks for performance measurement.
- Indexes provide insights into market trends and investor sentiment.
- Understanding various index methodologies helps in making informed investment decisions.
What Exactly is a Financial Index? More Than Just a Number
Before we delve into the ‘underlying’ aspect, let’s solidify our understanding of what a financial index is in its most basic form. An index is a statistical measure of the performance of a portfolio of assets, typically stocks, bonds, or commodities. It serves as a proxy for a larger market or market segment. Imagine trying to track the performance of every single publicly traded company in the United States. It would be an impossible task for any individual investor. An index solves this by selecting a representative sample and applying a specific formula to calculate its value based on the prices of those components.
Indexes are not created arbitrarily. They are meticulously designed based on criteria such as market capitalization, sector, geographic region, or even specific investment factors. The calculation method, or weighting methodology, is also crucial. Some indexes are price-weighted, meaning components with higher share prices have a greater influence (like the Dow Jones Industrial Average). Others are market-value-weighted (or capitalization-weighted), where companies with larger total market values have more sway (like the S&P 500 and Nasdaq Composite). Understanding this methodology is key to interpreting index movements; a large move in a heavily weighted stock can significantly impact the index’s overall performance, even if many smaller components moved in the opposite direction.
The US Index Landscape: Pillars of the Market
Let’s focus on the prominent US indexes you likely hear about daily. The S&P 500 is arguably the most widely followed equity index globally, representing the performance of 500 of the largest publicly traded companies in the United States. Due to its broad coverage of large-cap stocks across various sectors, it is often considered the best single gauge of the US equity market’s overall health. Its market-value-weighted structure means companies like Apple, Microsoft, and NVIDIA, with massive market capitalizations, have a substantial impact on its movements. When the S&P 500 rises, it typically signifies optimism and growth in America’s largest corporations.
| Index Name | Components | Weight Type | Description |
|---|---|---|---|
| S&P 500 | 500 Large-Cap Stocks | Market Value | Widely followed US equity index. |
| DJIA | 30 Blue-Chip Stocks | Price | Historic US index with major companies. |
| NASDAQ Composite | 3000+ Tech Stocks | Market Value | Key indicator for tech sector performance. |
The Dow Jones Industrial Average (DJIA), while historically significant, is composed of just 30 “blue-chip” US companies. Unlike the S&P 500, it is price-weighted. This means a $1 change in a high-priced stock in the index has a greater effect than a $1 change in a lower-priced stock, regardless of their market capitalization. While less representative of the total market than the S&P 500, the Dow 30’s components are giants of American industry, and its movements still provide insight into investor sentiment towards these large, established firms.
The NASDAQ Composite index is known for its heavy concentration of technology and growth companies. It includes over 3,000 stocks listed on the Nasdaq Stock Market and is also market-value-weighted. Its performance is a key indicator of the health of the tech sector and innovation-driven companies. The Russell 2000, in contrast, focuses on small-capitalization US companies. Tracking its performance gives us a pulse on smaller, domestically focused businesses, which can sometimes behave quite differently than their large-cap counterparts, as we saw with its recent decline while major indexes rose.
A Global Perspective: Tracking International Markets
Expanding our view beyond the US, international indexes provide crucial insights into the health of global economies and investment opportunities. The FTSE 100, for example, tracks the 100 largest companies listed on the London Stock Exchange by market capitalization. It’s a key benchmark for the UK market. In continental Europe, major indexes include Germany’s DAX P (30 largest companies listed on the Frankfurt Stock Exchange), France’s CAC 40 (40 largest companies listed on Euronext Paris), and the broader EURO STOXX 50 I (50 largest stocks in the Eurozone). Their movements reflect the economic sentiment and corporate performance within these major European economies.
Asia offers a diverse range of significant indexes. The HANG SENG INDEX in Hong Kong is a key barometer for that market and provides exposure to major Chinese companies listed there. Japan’s Nikkei 225, South Korea’s KOSPI Composite Index, Taiwan’s TWSE Capitalization Weighted Stock Index, and Australia’s S&P/ASX 200 are all critical benchmarks for understanding market performance in their respective countries and the broader Asia-Pacific region. Observing recent gains in some of these markets, while others saw losses (like the IDX Composite in Indonesia), underscores the often-varied economic cycles and investor sentiment across different nations, even within the same continent. Understanding these indexes and the markets they represent is essential for anyone looking to diversify globally.
The Crucial Concept: Why an Index is Your Underlying Asset (Sort Of)
Here is where we hit the core concept of this discussion: the underlying index. Despite tracking the performance of assets like stocks or bonds, an index itself is *not* a physical asset you can buy, sell, or own directly. You cannot walk into a brokerage and say, “I’d like to buy one S&P 500, please.” An index is a mathematical construct, a calculation, a benchmark. It exists purely as a number reflecting the aggregated value and movement of its components.
So, if you can’t invest in an index directly, how do you benefit from its performance? This is where the concept of the underlying index becomes critical. Indexes serve as the *benchmark* or the *target* for a vast array of financial products. These products are designed to replicate, track, or otherwise derive their value from the movement of a specific index. The index, in this context, is the “underlying” basis upon which the investment product is built. It’s like wanting to bet on the average height of a basketball team; you can’t literally buy the “average height,” but you can buy a contract that pays you based on how that average changes.
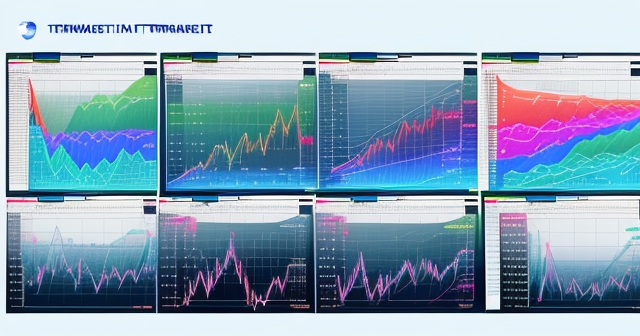
This distinction is vital for investors. When you invest in a product linked to an index, you are not buying the index itself. You are buying a fund, a contract, or a derivative whose performance is contractually tied to the index’s performance. The index provides the target, the reference point, the standard against which the product’s success is measured. It is the invisible foundation supporting the visible investment vehicle.
ETFs and Index-Based Investing: Bringing the Underlying to Life
Perhaps the most common way investors interact with an underlying index is through Exchange Traded Funds (ETFs). An ETF is a type of investment fund that holds assets like stocks, bonds, or commodities and trades on an exchange like a regular stock. The vast majority of ETFs are designed to track the performance of a specific index as closely as possible. For example, an S&P 500 ETF will hold stocks in proportions similar to their weighting in the S&P 500 index, aiming to mirror its returns before fees.
When you buy shares of an S&P 500 ETF, you are not buying the index, but rather a proportional stake in a portfolio of stocks *designed to replicate the index’s performance*. The S&P 500 is the underlying index for that ETF. Its value fluctuates as the value of the underlying index fluctuates. This is the essence of index-based investing or passive investing – aiming to achieve market returns by simply tracking a benchmark index, rather than actively trying to pick individual winning stocks or time the market.
Recent news highlights the dynamic nature of the ETF market, with activity in products focused on Real Estate, Energy Infrastructure, Electrification Metals, and Buffer ETFs. Each of these ETFs is likely linked to a specific underlying index or a custom index designed to capture the performance of that particular sector or strategy. For instance, a Real Estate ETF might track a Real Estate Investment Trust (REIT) index, while an Energy Infrastructure ETF could track an index composed of pipeline and energy transmission companies. These examples showcase how indexes, as underlying benchmarks, enable investors to gain targeted exposure to specific segments of the market with relative ease and liquidity.
Beyond Price: Volatility and Other Indexes
Not all indexes track the price performance of traditional assets. Some, like the Cboe Volatility Index (VIX), track market sentiment and expectations. The VIX is often referred to as the “fear index” because it measures the market’s expectation of future volatility based on the prices of S&P 500 index options. A rising VIX typically indicates increasing market fear and expectation of larger price swings, often coinciding with falling equity markets. Conversely, a low VIX suggests market complacency and expectations of stable prices.
The VIX uses the S&P 500 as its underlying index, but it calculates a measure of expected volatility, not the price return itself. Understanding indexes like the VIX adds another dimension to our market analysis, moving beyond simple price movements to gauge underlying sentiment and potential future risk. Similarly, there are indexes for bond yields, commodity prices, and currency strength (like the US Dollar Index), each providing a different lens through which to view the financial landscape, often serving as underlying references for other financial products.
| Index Type | Index Name | Purpose |
|---|---|---|
| Volatility Index | Cboe Volatility Index (VIX) | Measures market sentiment and expectations. |
| Currency Index | US Dollar Index | Tracks the dollar’s strength against a basket of currencies. |
| Commodity Index | Commodity Research Bureau Index | Measures price changes in commodity markets. |
Speaking of currency, the movement of major currency pairs like EUR/USD, as noted in the market data, reflects the relative economic strength and monetary policy expectations between the Eurozone and the United States. Currency indexes measure the value of one currency against a basket of others, providing a broader picture of its strength or weakness. Understanding how currency markets move is crucial for global investors, as it impacts the value of international assets and can influence the performance of regional indexes. If you’re interested in exploring these currency markets directly, perhaps through trading platforms, understanding the factors that drive their movements and the tools available becomes paramount.
If you’re considering delving into forex trading or exploring more difference contract (CFD) products linked to various underlying assets, then Moneta Markets is a platform worth considering. Originating from Australia, it offers a wide array of over 1000 financial instruments, catering to both novice and experienced traders.
Interconnected Markets: How Other Assets Influence Indexes
Financial markets do not exist in isolation. The performance of stock indexes is often influenced by movements in other asset classes, such as bonds, commodities, and currencies. For instance, a decline in Treasury yields, like the 10-Yr Bond yield mentioned in the data, can signal shifts in interest rate expectations or a move towards safer assets. Lower yields can make equities more attractive by comparison, potentially supporting stock index values, while rising yields can have the opposite effect, particularly on growth stocks.
Commodity prices, such as those for Crude Oil and Gold, also play a role. Rising oil prices can impact inflation expectations and the profitability of energy-intensive companies, influencing relevant sector indexes and potentially broader market benchmarks. Gold, often seen as a safe-haven asset, may see increased demand (and price increases) during times of market uncertainty, which could coincide with declines in equity indexes like the S&P 500 or Nasdaq.
Currency fluctuations, as discussed earlier, directly affect international trade and the profitability of multinational corporations whose stocks are components of major indexes. A strong US dollar can make US exports more expensive, potentially hurting the earnings of large-cap US companies in the S&P 500 and Dow 30, particularly those with significant international revenue. Understanding these interdependencies allows for a more nuanced interpretation of why an underlying index moves the way it does on any given day or period.
Using Index Data in Your Investment Journey
How can you, as an investor or aspiring trader, effectively use the information provided by indexes and the concept of the underlying index? Firstly, indexes are your primary tool for understanding the broader market context. Monitoring the S&P 500, Nasdaq, and relevant global indexes gives you a snapshot of where the market is headed and which sectors or regions are leading or lagging. This macro-level perspective is crucial for making informed decisions about your overall asset allocation.
Secondly, indexes serve as benchmarks for evaluating performance. If you invest in a US large-cap mutual fund or ETF, you would compare its returns to the S&P 500. If you hold international stocks, you might compare their performance to indexes like the MSCI Europe, Australasia, and Far East (EAFE) Index. Benchmarking helps you determine if your investments are keeping pace with the market or if your active strategies are truly adding value compared to a passive index-tracking approach.
Thirdly, indexes are the gateway to targeted exposure. Want to invest specifically in technology? You can find ETFs that track the Nasdaq 100 (the 100 largest non-financial companies listed on Nasdaq) or sector-specific tech indexes. Interested in emerging markets? There are indexes and linked products for that too. By understanding the composition and weighting methodology of different indexes, you can select the products that best align with your investment goals and risk tolerance, utilizing the index as the underlying foundation for your portfolio exposure.
Data, Technology, and the Evolution of Tracking
The availability of real-time market data is fundamental to the functionality of indexes and the products that track them. Companies like Nasdaq and FactSet provide the data feeds necessary to calculate index values continuously throughout the trading day. This technological backbone ensures that the prices you see for index-tracking ETFs, for example, accurately reflect the current value of their underlying index.
The financial technology landscape is constantly evolving, leading to more sophisticated ways of tracking indexes and creating new index-linked products. While passive index-tracking ETFs are widely popular, there are also actively managed ETFs, factor-based ETFs (tracking indexes focused on specific investment styles like value or growth), and even leveraged or inverse ETFs designed to deliver magnified or opposite returns of an underlying index (though these come with significant risks). Understanding the technology and methodology behind these products and their relationship to the underlying index is crucial for their effective and safe use.
Choosing the right tools and platforms is also part of leveraging this knowledge. For instance, if your strategy involves diverse asset classes or specific trading techniques, the capabilities of your trading platform become important. When looking for a trading platform, Moneta Markets‘ flexibility and technological advantages are worth noting. It supports major platforms like MT4, MT5, and Pro Trader, combining high-speed execution with competitive low spread settings, offering a robust trading environment for exploring various markets, potentially including those tracking underlying indexes or currency pairs.
Conclusion: Indexes as Your Market Compass
In conclusion, financial indexes are far more than just abstract numbers; they are the essential benchmarks that define and measure market performance across regions, sectors, and asset classes. Understanding that an index is a statistical construct and serves as the underlying index for investable products like ETFs is a fundamental concept for navigating the modern financial markets. By tracking global indexes, appreciating their composition and methodology, and recognizing their role as the foundation for diverse investment vehicles, you gain powerful tools for market analysis, portfolio construction, and performance evaluation.
The market is a complex, interconnected system, with index movements influenced by a myriad of factors, from corporate earnings and economic data to global events and shifts in investor sentiment. Using indexes as your compass, coupled with a deep understanding of the underlying index concept and the products built upon it, empowers you to make more informed decisions on your investment journey. Keep learning, stay analytical, and continue exploring the vast opportunities that the world of financial markets offers.
underlying indexFAQ
Q:What is an underlying index?
A:An underlying index is a benchmark that reflects the performance of a specified group of assets, used as a basis for investment products.
Q:How can I invest in an underlying index?
A:You can invest in products like ETFs that track an underlying index’s performance without purchasing the index directly.
Q:What are the different types of financial indexes?
A:Diverse financial indexes include equity indexes, bond indexes, volatility indexes, and currency indexes, each serving different purposes.
