
Understanding Trading Divergence: A Core Technical Concept
Welcome, fellow explorers of the financial markets. As you delve into the world of technical analysis, you quickly learn that understanding trends and predicting potential shifts is crucial for making informed trading decisions. We rely on various tools and indicators to help us navigate the complex interplay of supply and demand reflected in price movements. But what happens when the map seems to disagree with the terrain? This is where the powerful concept of trading divergence comes into play.
At its heart, divergence is a warning signal, a subtle hint from the market that the current trend may be losing its steam. Think of it like driving a car uphill; you’re gaining altitude (price is rising), but if you notice the engine RPMs starting to drop significantly (an indicator losing momentum), you might anticipate that you can’t maintain that speed much longer. Divergence works on a similar principle, highlighting discrepancies between price action and technical indicators, often suggesting a potential reversal or consolidation phase is on the horizon. Mastering the identification and interpretation of divergence can add a valuable layer of depth to your analytical toolkit, moving you beyond simply following the price.
In the coming sections, we will embark on a journey to understand what divergence is, how to spot it reliably on your charts, why it occurs, and most importantly, how you can use it effectively in your trading strategy, particularly for trade management and risk assessment. Let’s uncover this essential technical concept together.
Understanding trading divergence can be summarized with these key points:
- Divergence signals a potential trend shift in the market.
- It highlights discrepancies between price movement and indicators.
- Mastering divergence can enhance your trading strategy.
| Key Terms | Definitions |
|---|---|
| Divergence | A situation where the price of an asset and an indicator show opposing movements. |
| Bullish Divergence | Occurs when price makes a lower low while the indicator makes a higher low, suggesting potential upward movement. |
| Bearish Divergence | Occurs when price makes a higher high while the indicator makes a lower high, indicating potential downward movement. |
The Core Idea: Price and Indicator Disagreement
Divergence arises from a fundamental disagreement between the price of an asset and the reading of a technical indicator, usually an oscillator or a momentum indicator. Typically, price and indicators move in tandem. If price makes a new high, a momentum indicator like the Relative Strength Index (RSI) or Moving Average Convergence Convergence Divergence (MACD) will also tend to make a new high or at least confirm the upward movement with a similar trajectory. This harmonious movement is called confirmation, and it reinforces the strength of the existing trend.
However, divergence happens when this harmony breaks. Price might be moving in one direction, seemingly continuing its trend by setting a new high or low, but the indicator tells a different story. The indicator fails to match the price’s extreme, creating a “divergence” or separation in their paths. This separation suggests that the underlying buying or selling pressure that was fueling the trend might be weakening, even if the price is still pushing forward based on residual momentum or other factors.
Understanding this core disagreement is key. It’s the market whispering to you, “Hey, something is changing under the hood.” While price is the ultimate truth, indicators, particularly oscillators, provide insights into the *rate* and *strength* of price changes. When the strength or rate doesn’t keep pace with the price’s progress, it’s a signal worth investigating. We primarily look for divergence in relation to swing highs and swing lows on the chart, comparing these price extremes to the corresponding levels on our chosen indicator.
Types of Divergence: Bullish (Positive) vs. Bearish (Negative)
There are two primary types of divergence that traders look for, each signaling a potential shift in a different direction. These are bullish divergence and bearish divergence. Some texts also refer to these as positive and negative divergence, respectively. While the terminology might vary slightly, the core concepts and their implications remain the same.
Recognizing which type you are seeing is critical, as it points towards the potential direction of the subsequent price movement. Let’s break down each type so you can clearly differentiate them and understand what they are telling you about the market’s underlying dynamics. Both types rely on identifying specific patterns of swing highs and swing lows on both the price chart and the selected indicator.
It’s important to remember that divergence is typically observed when price is making new extremes relative to recent price action – either new highs in an uptrend or new lows in a downtrend. This is when the indicator’s failure to follow suit becomes a meaningful signal of potential trend exhaustion. We will explore each type in more detail in the following sections.
Bullish Divergence: Reading the Signs of Potential Strength
Bullish divergence, or positive divergence, occurs during a downtrend or a period of price consolidation near lows. It is identified when:
- Price makes a lower low (or sometimes equal lows).
- The corresponding technical indicator makes a higher low (or sometimes equal lows).
Let’s visualize this. Imagine the price of an asset is in a clear downtrend, falling to new lows repeatedly. You draw a line connecting two consecutive swing lows on the price chart, and the line slopes downwards. Now, look at the same two points in time on your chosen momentum indicator, like the RSI. You connect the corresponding low points on the RSI, but this time, the line connecting them slopes upwards, meaning the second low on the RSI is higher than the first. This is bullish divergence.
What is this telling us? Despite the price falling to a new low, the selling pressure, as measured by the indicator’s momentum, is actually less intense than it was during the previous low. The rate of decline is slowing, or the buyers are stepping in more forcefully at these lower prices than they were before. It’s like the car is going downhill, but the brakes aren’t being applied as hard. This can signal that the downtrend is losing momentum and a potential upward price movement, either a reversal or a significant bounce (pullback), could be imminent.
For example, if Bitcoin (BTC) price makes a new low of $25,000 after a previous low of $26,000, but the RSI reading at $25,000 is 35, while the RSI reading at the $26,000 low was 30, you have bullish divergence. The price went lower, but the RSI made a higher low (35 > 30). This suggests the selling pressure is weakening despite the price dropping further, potentially setting the stage for a rally.
Bearish Divergence: Recognizing Warnings of Potential Weakness
Conversely, bearish divergence, or negative divergence, occurs during an uptrend or a period of consolidation near highs. It is identified when:
- Price makes a higher high (or sometimes equal highs).
- The corresponding technical indicator makes a lower high (or sometimes equal highs).
Think about an asset’s price steadily rising, forming higher highs as the uptrend progresses. You draw a line connecting two consecutive swing highs on the price chart, and the line slopes upwards. Now, you look at the same two points in time on your indicator, like the MACD histogram. You connect the corresponding high points on the MACD histogram, but the line connecting them slopes downwards, meaning the second high on the MACD is lower than the first. This is bearish divergence.
| Type of Divergence | Characteristics |
|---|---|
| Bullish Divergence | Price makes a lower low; indicator makes a higher low. |
| Bearish Divergence | Price makes a higher high; indicator makes a lower high. |
What’s the market communicating here? Even though the price managed to push to a new high, the buying momentum, as indicated by the oscillator, is weaker than it was during the previous high. The rate of ascent is slowing, or sellers are starting to step in more aggressively at these higher prices. It’s like the car is going uphill, but the engine is struggling more than it was earlier. This can signal that the uptrend is losing momentum and a potential downward price movement, such as a reversal or a correction (pullback), could be on the horizon.
For instance, if Ethereum (ETH) price makes a new high of $3,500 after a previous high of $3,400, but the Stochastic Oscillator reading at $3,500 is 70, while the Stochastic reading at the $3,400 high was 80, you have bearish divergence. The price went higher, but the Stochastic made a lower high (70 < 80). This suggests the buying pressure is weakening despite the price rising further, potentially signaling an impending price drop.
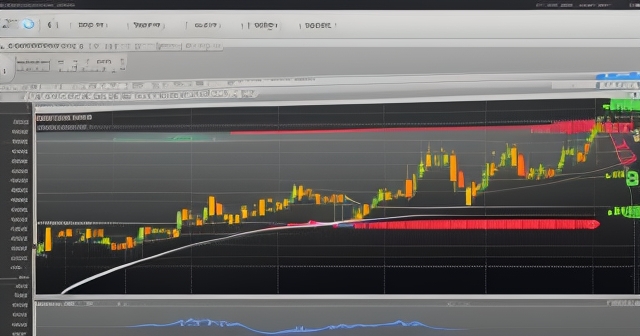
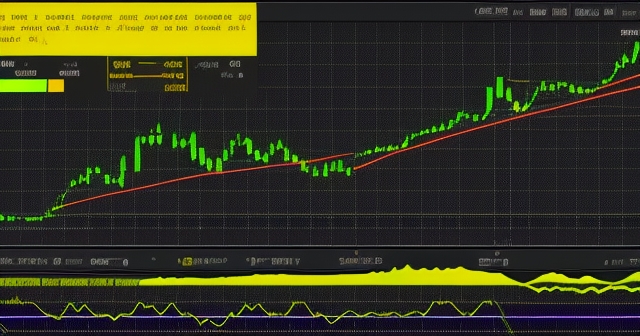
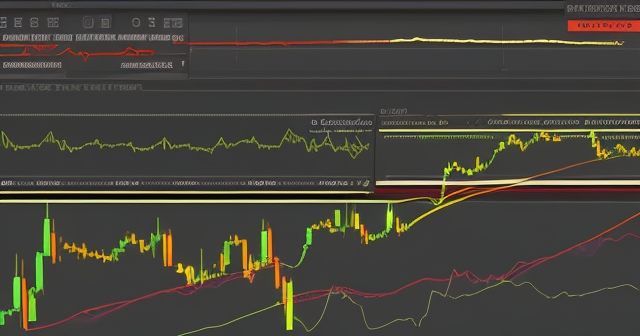
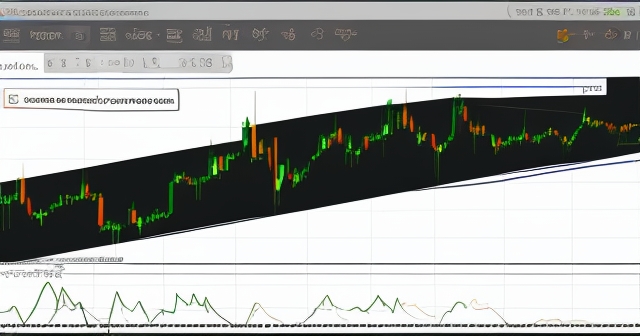
How to Identify Divergence: A Step-by-Step Visual Guide
Spotting divergence reliably on your charts requires practice and attention to detail. It’s not simply about glancing at a chart; it involves a structured process of observation and comparison. Here is a step-by-step guide to help you identify potential trading divergence:
- Identify a Clear Price Trend or Significant Price Swing. Divergence is most meaningful following a sustained trend (up or down) or after significant swing highs or lows. Look for periods where price has made consecutive higher highs in an uptrend or consecutive lower lows in a downtrend. Double Tops and Double Bottoms can also be points where divergence forms if the indicator does not match the price level on the second peak/trough.
- Add a Momentum Oscillator to Your Chart. Choose a reliable oscillator such as the RSI, MACD, or Stochastic Oscillator. These are commonly used because they are designed to measure the speed and change of price movements, making them ideal for spotting momentum discrepancies.
- Locate Prominent Swing Highs or Swing Lows on the Price Chart. Identify the most recent significant peaks or troughs in the price data that correspond to the current trend or price movement you are analyzing. These are the points you will compare.
- Locate the Corresponding Points on the Indicator. This is a crucial step requiring vertical alignment. For each swing high or swing low identified on the price chart, find the exact point in time on the indicator below it. For a price swing high, find the indicator reading at the very same point in time. For a price swing low, find the indicator reading at that specific point in time.
- Draw Lines Connecting the Price Swings and Corresponding Indicator Points. Draw a straight line connecting the two consecutive swing highs or swing lows on the price chart. Then, draw another straight line connecting the *corresponding* points on the indicator chart.
- Look for Diverging Slopes. Compare the direction of the lines you have drawn. If price makes lower lows (downward slope) but the indicator makes higher lows (upward slope), you have bullish divergence. If price makes higher highs (upward slope) but the indicator makes lower highs (downward slope), you have bearish divergence.
Remember, maintaining vertical alignment between price and indicator points is paramount. Comparing a price low to an indicator low that occurred at a significantly different time will lead to false signals. This step-by-step visual approach is the standard method used by technical analysts worldwide.
The Best Indicators for Spotting Divergence (RSI, MACD, etc.)
While theoretically, divergence can be observed with various indicators, it is most commonly and effectively identified using momentum oscillators. These indicators are specifically designed to measure the speed and strength of price changes, making them ideal for spotting discrepancies between price movement and underlying force. Here are some of the most popular oscillators for identifying trading divergence:
- Relative Strength Index (RSI): Perhaps the most widely used indicator for divergence. The RSI measures the magnitude of recent price changes to evaluate overbought or oversold conditions. When price makes a new high but RSI makes a lower high (bearish divergence), or price makes a new low but RSI makes a higher low (bullish divergence), it’s a strong signal.
- Moving Average Convergence Divergence (MACD): The MACD is a trend-following momentum indicator that shows the relationship between two moving averages of an asset’s price. Divergence often shows up between the price and the MACD line or, more commonly, the MACD histogram. A bearish divergence occurs when price makes higher highs, but the MACD histogram makes lower highs. A bullish divergence occurs when price makes lower lows, but the MACD histogram makes higher lows.
- Stochastic Oscillator: This indicator compares a specific closing price of an asset to a range of its prices over a period of time. Divergence is spotted similarly to RSI and MACD, looking for discrepancies between price extremes and the Stochastic lines (%K and %D).
- Rate Of Change (ROC): The ROC is a momentum oscillator that measures the percentage change in price between the current price and a price ‘n’ periods ago. Divergence is identified by comparing the ROC’s highs/lows to price highs/lows.
Each of these indicators has its own characteristics and can sometimes show divergence when others do not. Many traders prefer using a combination or finding which one works best for their chosen market and time frame. Regardless of which oscillator you choose, the underlying principle of comparing price extremes to indicator extremes at corresponding times remains constant. These tools are readily available on most modern trading platforms, including those favored for detailed charting and analysis.
If you are exploring different financial instruments, including Forex trading or various CFD products, finding a platform that seamlessly integrates these essential technical indicators is key. If you’re considering starting Forex trading or exploring more CFD products, then Moneta Markets is a platform worth considering. It’s from Australia and offers over 1000 financial instruments, suitable for both beginners and professional traders.
Divergence and Momentum: Understanding the “Why” Behind the Signal
To truly grasp the power of trading divergence, we need to understand its relationship with momentum. Price action tells us where an asset has been and where it is currently trading. Momentum indicators, on the other hand, measure the *speed* and *strength* of that price movement. They provide insight into the force driving the price.
In a healthy uptrend, each new high should ideally be reached with the same or greater buying pressure as the previous high. A momentum indicator confirming new highs alongside price signifies that the bullish force is sustained. Similarly, in a healthy downtrend, new lows should be accompanied by sustained selling pressure, confirmed by momentum indicators making new lows.
Divergence occurs when this expected relationship breaks down. When price pushes to a new high, but the indicator shows less momentum than at the previous high (bearish divergence), it means that while buyers *could* still push the price higher, they did so with less conviction or participation. The underlying buying pressure is weaker. It’s like the car is still accelerating and hitting new speeds, but the engine is working less efficiently, hinting it might soon run out of gas.
Conversely, when price makes a new low, but the indicator shows less selling pressure than at the previous low (bullish divergence), it indicates that sellers *could* still push the price lower, but they did so with less force. Buyers might be quietly absorbing the selling or stepping in more strongly at these reduced prices. It’s like the car is rolling downhill and hitting new low points, but someone is gently applying the brakes, reducing the speed of the descent.
Therefore, divergence isn’t just a pattern; it’s a reflection of weakening momentum relative to price movement. It tells us that the force propelling the trend is diminishing, making the trend more vulnerable to a reversal or at least a significant pause (consolidation or pullback). Understanding this link between price, momentum, and divergence provides a deeper insight into market dynamics than simply observing price action alone.
Applying Divergence in Real Trading: Beyond Simple Entry Signals
Now that we understand what trading divergence is and how to spot it, the crucial question becomes: How do we actually use it in trading? While some traders might attempt to use divergence as a primary entry signal, professional traders often utilize it differently. Divergence is frequently considered a warning sign or a piece of confirmatory evidence rather than a standalone trigger for entering a trade.
Think about it. If you see bearish divergence in an uptrend, it doesn’t mean the price *will* reverse immediately. The divergence could persist for some time as price continues to grind higher before any significant move occurs. Using it solely as an entry signal can lead to premature trades, getting stopped out before the anticipated move happens, or being trapped in a trend that continues longer than expected despite the divergence.
Its greatest value often lies in confirming potential opportunities identified through other means or, more importantly, in trade management. If you are already in a long position and you spot bearish divergence, it’s a signal to become cautious. It might suggest tightening your stop-loss order, taking partial profits, or avoiding adding to your position. Similarly, if you are short and spot bullish divergence, it might be time to manage your risk by raising stops or considering taking profits.
Divergence can also be used as a filter or confirmation for other trading strategies. For example, if you have a trading system that generates a buy signal based on a chart pattern (like a double bottom) and you also see bullish divergence forming concurrently, the divergence adds confluence and increases the probability that the chart pattern signal is valid. It provides an extra layer of confirmation from a momentum perspective.
In essence, divergence tells you that the market is *pregnant* with the potential for a change, but it doesn’t give you the precise timing or guarantee the outcome. Its utility is maximized when combined with other tools and strategies, particularly within a robust framework of trade management.
Managing Your Trades with Divergence Signals
As highlighted, one of the most practical and valuable applications of trading divergence is in managing your existing trades. Once you are in a position, monitoring for divergence can provide critical clues about the health of the trend that you are trading and help you protect your capital and profits.
- Protecting Profits: If you are long in an uptrend and see bearish divergence appearing on a higher time frame, it’s a strong hint that the trend might be running out of steam. This is an excellent time to consider taking some or all of your profits off the table. You don’t need to wait for a full reversal to occur. Locking in gains based on this warning signal is prudent trade management.
- Tightening Stop Losses: Alternatively, or in addition to taking profits, you can use divergence as a cue to move your stop-loss order closer to the current market price. This reduces your potential risk exposure if the anticipated reversal or pullback does occur. If the price continues in the direction of your trade despite the divergence, your tightened stop still offers protection.
- Avoiding Adding to Positions: In a strong trend, traders sometimes look for opportunities to add to winning positions on pullbacks. However, if you see divergence forming, it might be wise to avoid adding to your position. The divergence suggests that the underlying momentum is weak, meaning the trend might not have enough strength for a significant continuation after a pullback.
- Preparing for Potential Reversals: If you are an experienced trader who incorporates reversal strategies, divergence can serve as an early heads-up to start looking for concrete reversal signals (like specific candlestick patterns, trendline breaks, or chart patterns) in the direction the divergence suggests. It prepares you mentally and strategically for a potential shift.
Using divergence in this way shifts its focus from predicting market moves with absolute certainty to adjusting your risk and managing your open positions intelligently based on signals of weakening momentum. It’s about being proactive in protecting your capital rather than reactive to sudden adverse price movements. Sound trade management is a cornerstone of consistent profitability, and divergence is a valuable tool in this regard.
Limitations and Nuances: What Divergence Doesn’t Tell You
Like any technical tool, trading divergence is not without its limitations. Relying solely on divergence signals can lead to frustration and losses. Acknowledging these nuances is crucial for developing a robust trading strategy that incorporates divergence effectively and adheres to EEAT principles (specifically Trustworthiness).
- Timing Uncertainty: Divergence tells you that a potential change *may* be coming, but it provides no information about *when* that change will occur. Divergence can persist for many candles or periods on your chart before price finally reacts. Trading solely based on divergence can lead to long periods of sitting in a trade that moves sideways or even slightly against you before the anticipated move.
- Not Every Reversal is Preceded by Divergence: It’s a common misconception that you will see divergence before every single trend reversal. This is not true. Strong reversals can happen swiftly due to fundamental news, unexpected events, or sudden shifts in sentiment, without any prior divergence manifesting on your charts. Relying *only* on divergence to signal reversals means you will miss many significant moves.
- Can Occur in Strong Trends Without Reversal: Sometimes, particularly in very strong, parabolic trends, you might see divergence appear, but the price simply continues to power through it. The underlying fundamental forces or market psychology are so strong that the temporary dip in momentum shown by the indicator is quickly overwhelmed.
- Risk of False Signals: On lower time frames (e.g., M1, M5, M15), market noise can cause indicators to behave erratically, leading to numerous false divergence signals. This is why many experienced traders prefer to analyze divergence on higher time frames.
- Requires Confirmation: Divergence is best viewed as a warning or a heads-up. It significantly increases its reliability when confirmed by other forms of technical analysis, such as a break of a trendline, a significant support or resistance level being breached, a recognizable chart pattern forming, or confirmation from volume analysis (though volume can be a lagging indicator itself).
Understanding these limitations is not a reason to dismiss divergence, but rather a reason to use it wisely. It is a valuable piece of the puzzle, not the entire picture. Always combine divergence analysis with other technical tools and, most importantly, sound risk management principles.
Enhancing Divergence Signals with Confluence and Time Frames
Given the limitations discussed, how can we maximize the effectiveness of trading divergence? The answer lies in seeking confluence and paying close attention to time frames.
Confluence: Confluence in trading refers to the occurrence of multiple independent trading signals pointing in the same direction. When you spot divergence, look for other technical signals that reinforce the message. Does the divergence occur near a significant horizontal support or resistance level? Is there a recognizable chart pattern forming (like a Head and Shoulders top after bearish divergence, or an Inverse Head and Shoulders bottom after bullish divergence)? Is the divergence accompanied by increasing or decreasing volume in a manner that supports the potential move? For example, bearish divergence combined with a break below a key trendline significantly strengthens the likelihood of a downturn compared to just the divergence alone.
Time Frames: The time frame on which you observe divergence profoundly impacts its significance. Divergence on a 5-minute chart might signal a small, short-lived pullback. Divergence on a daily or weekly chart, however, can signal a major trend reversal or a significant multi-week or multi-month consolidation period. Longer time frames filter out much of the market noise and provide a clearer view of the underlying momentum dynamics. While intraday traders can look for divergence on 1-hour or 4-hour charts for anticipating moves within the trading day, swing traders and long-term investors will find daily and weekly chart divergence far more relevant for their decisions.
By combining divergence with confluence from other technical tools and analyzing it on appropriate time frames, you can significantly increase the probability of success when acting on these signals. It moves divergence from being a potentially misleading pattern to a powerful component of a multi-faceted trading strategy. Applying these techniques requires a reliable platform that provides access to a wide range of instruments and robust charting tools.
When you are looking for a trading broker that offers flexibility and technical advantages, the capabilities of Moneta Markets are worth mentioning. It supports popular platforms like MT4, MT5, and Pro Trader, combining high-speed execution with competitive spread settings to provide a favourable trading experience for applying sophisticated technical analysis like divergence across various markets.
Real-World Examples: Divergence in Cryptocurrency and Other Markets
Trading divergence is a universal concept applicable across various financial markets, including stocks, Forex, commodities, and notably, cryptocurrency. Due to the volatile nature of crypto markets, divergence signals can sometimes be particularly pronounced and offer valuable insights.
Consider the cryptocurrency market, for instance. Analysts frequently watch for divergence between Bitcoin (BTC) price and indicators, or even between Altcoin indices (like TOTAL3, representing the total market cap of altcoins excluding BTC and ETH) and Bitcoin’s performance (e.g., the TOTAL3/BTC ratio chart). If Bitcoin makes new highs, but a broad altcoin index like TOTAL3 or the OTHERS/BTC ratio fails to confirm those highs and shows bearish divergence against BTC, it could signal that liquidity is flowing out of altcoins into Bitcoin (or stablecoins/USD) – a potential shift in market dynamics.
Similarly, during altcoin rallies, bullish divergence on smaller cap altcoins or specific altcoin/BTC pairs could signal that specific tokens are starting to gain independent strength relative to Bitcoin, potentially leading to significant individual pumps even if the broader market is consolidating. Observing divergence in volume indicators (like On-Balance Volume, OBV) alongside price and momentum indicators can provide further confluence.
In traditional markets, a stock like Nvidia or indices like the Nasdaq or S&P 500 can exhibit clear divergence before major tops or bottoms. Bearish divergence appearing on the S&P 500 daily chart while the index makes a new all-time high could warn large institutional traders to reduce exposure or hedge their positions, even before any fundamental news hits. Analyzing divergence on assets like gold or oil using indicators like RSI or MACD is also a common practice among commodity traders.
These real-world examples across different asset classes demonstrate that the principle of divergence – the disagreement between price and momentum – is a fundamental aspect of market behavior. Learning to identify and interpret it, while always considering the market context and combining it with other analysis, provides a powerful edge in anticipating potential shifts.
Crafting Your Strategy: Integrating Divergence Effectively
Now that you have a solid understanding of trading divergence, its types, identification methods, relationship with momentum, applications, and limitations, the next step is to integrate it effectively into your own trading strategy. This isn’t about throwing away everything else you do; it’s about adding a sophisticated layer of analysis.
Here are some ways you can craft your strategy using divergence:
- As a Warning System: Continuously monitor your open positions for divergence on your preferred time frames. Use it as a prompt to review your stop-loss, consider partial profits, or assess if the trade is still as valid as when you entered. This proactive risk management can save you from giving back profits during unexpected reversals.
- As a Confirmation Tool: If your existing strategy generates a buy or sell signal (e.g., a trendline break, a moving average crossover, a chart pattern completion), check if there is corresponding divergence. Bullish divergence supporting a buy signal, or bearish divergence supporting a sell signal, adds strength and confidence to that original signal. This helps filter out weaker signals.
- For Identifying Potential Counter-Trend Trades (with Caution): For more experienced traders, divergence can help identify potential turning points for counter-trend trades. However, this is riskier. Always wait for price confirmation (e.g., a clear reversal candle, a break of a short-term trendline) after seeing divergence before attempting a counter-trend entry.
- To Gauge Trend Strength: Even if you don’t act on every divergence signal, simply identifying it helps you assess the underlying health of the current trend. A trend showing repeated bearish divergence is clearly weaker than one showing sustained momentum alongside price.
Remember to start by practicing identifying divergence on historical charts before applying it to live trading. Pay attention to which indicators and time frames seem to work best for the assets you trade. Document your observations and results. Like any skill in trading, mastering divergence takes time, practice, and disciplined application within a defined strategy.
If you are looking for a broker with regulatory assurance and the ability to trade globally, Moneta Markets holds multi-country regulatory certifications such as FSCA, ASIC, and FSA. It also offers full support, including segregated client funds, free VPS, and 24/7 Chinese customer service, making it a preferred choice for many traders applying detailed technical analysis.
Conclusion: Mastering the Art of Trading Divergence
In conclusion, trading divergence stands as a vital concept within the realm of technical analysis. It provides traders with a unique perspective by highlighting discrepancies between price action and the underlying momentum measured by technical indicators, particularly oscillators. By learning to spot bullish and bearish divergence, you gain a valuable warning signal about potential trend weakness or impending shifts.
We have explored what divergence is, its two main types, the systematic process of identifying it on charts using tools like RSI and MACD, and its crucial relationship with momentum. Critically, we’ve emphasized that while divergence can sometimes precede reversals, its primary utility often lies in serving as a warning for trade management – helping you protect profits and adjust risk on existing positions – and as a powerful confirmation tool when combined with other analytical techniques.
Remember the limitations: divergence doesn’t guarantee a reversal, nor does it provide precise timing, and it can produce false signals, especially on lower time frames or in very strong trends. Therefore, always seek confluence with other signals and practice sound risk management. By integrating divergence thoughtfully into your trading plan, using it on appropriate time frames, and combining it with other confirmation tools, you add a sophisticated layer of insight into the market’s true dynamics.
Mastering trading divergence is an art that requires diligent practice and experience. But the effort is well worth it, as the ability to recognize this fundamental pattern can significantly enhance your analytical capabilities and contribute to making more informed, potentially more profitable, trading decisions. Keep observing, keep learning, and apply these concepts diligently.
trading divergenceFAQ
Q:What is trading divergence?
A:Trading divergence refers to a situation when the price of an asset and its indicator show conflicting movements, signaling a potential trend change.
Q:How can I spot bearish divergence?
A:Bearish divergence is spotted when the price makes a higher high while the indicator makes a lower high, indicating weakening buying momentum.
Q:Is divergence a reliable trading signal?
A:Divergence can be a valuable warning sign, but should not be used in isolation and requires confirmation with other technical analysis tools.