
Understanding the S&P 500: More Than Just a Number
Welcome to our deep dive into the world of the S&P 500. Whether you’re just starting your investment journey or you’re a seasoned trader looking to refine your approach, understanding this benchmark index is absolutely crucial. Think of the S&P 500, officially known as the Standard & Poor’s 500, as the pulse of the large-cap U.S. stock market. It’s not just a random collection of stocks; it comprises 500 of the largest publicly traded companies in the United States by market capitalization. These aren’t necessarily the *largest* 500 companies in terms of pure size, but rather companies selected by a committee based on factors like market cap, liquidity, domicile, public float, sector classification, and financial viability. This selection process aims to make the index a robust and representative indicator of the health and performance of the large-cap segment of the U.S. economy.
For many investors and analysts, the S&P 500 is the primary benchmark against which the performance of their portfolios, mutual funds, or the broader market is measured. If you hear someone say, “the market was up today,” chances are they’re referring to a significant move in the S&P 500, or perhaps the Dow Jones Industrial Average or the Nasdaq Composite, but the S&P 500 is generally considered the most comprehensive representation of large-cap U.S. equities.
But what does this mean for you as a potential or active trader? It means that movements in the S&P 500 can significantly impact your investments, whether you hold individual stocks that are part of the index, own index funds or ETFs that track the S&P 500, or trade derivatives based on the index, such as futures, options, or Contracts for Difference (CFDs). Understanding the factors that influence its movement, the data points to watch, and the different perspectives on its future trajectory is key to making informed trading decisions. We’re here to help you navigate this complex landscape, breaking down the key elements like a seasoned guide would walk you through unfamiliar territory.
The Recent S&P 500 Surge: A Look at the Data
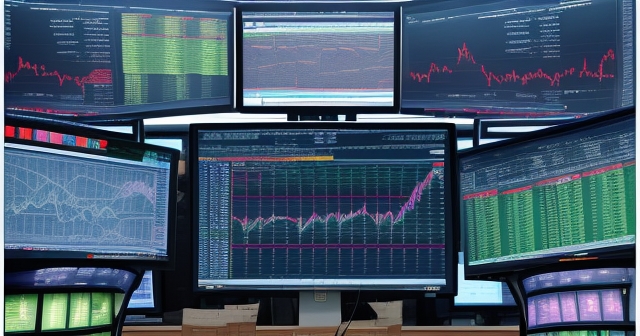
Let’s start by acknowledging the undeniable: the S&P 500 has been on an impressive upward trajectory. As of recent data, the index has not only recovered from past dips but has surged to new levels. On July 5th, 2024, for instance, the S&P 500 (.SPX) hit a new 52-week high, reaching 5,570.33. It closed that day slightly off the peak but still at a robust 5,567.19, marking a daily gain of +0.54%.
These numbers aren’t just statistics; they tell a story of strong market momentum over the past year. Looking at the broader picture, the performance is even more striking:
- Year-to-Date (YTD) Change: +16.72% – This shows substantial growth just within the first half of the year.
- 1 Year % Change: +25.19% – This highlights the significant gains realized by investors who held through the past year.
- 52-Week Range: 4,103.78 (Oct 27th, 2023) to 5,570.33 (July 5th, 2024) – This wide range illustrates the volatility but also the sustained upward climb from its lows.
Reaching a new 52-week high, especially one that coincides with an all-time record close, is a significant technical and psychological event in the market. It signals strong buying interest and often reflects underlying optimism about economic conditions and corporate earnings prospects. Alongside the S&P 500, the Nasdaq Composite also recently achieved a record close, further underscoring the positive sentiment, particularly in the technology sector which holds significant weight in both indices. This performance isn’t accidental; it’s the result of a complex interplay of economic factors, corporate health, investor sentiment, and global events.
Understanding these historical performance figures provides essential context. While past performance is never a guarantee of future results, knowing the index’s recent behavior – its peaks, troughs, and rate of change – is fundamental to any technical or fundamental analysis you might perform. It’s like looking at a map before starting a journey; you need to know where you’ve been to plan where you might go.
What Drives the S&P 500? Unpacking the Influences
If the S&P 500 is the pulse, what makes it beat? Its movements are influenced by a multitude of factors, broadly categorized into fundamental and technical drivers. As traders, we need to consider both to get a holistic view.
Fundamental Drivers: These relate to the underlying economic health and the performance of the companies within the index.
- Corporate Earnings: This is perhaps the most significant driver. When companies report strong profits and provide optimistic future guidance, it generally boosts investor confidence and stock prices. Conversely, weak earnings reports can trigger sell-offs. Given the S&P 500 represents 500 large companies, their collective earnings picture is a powerful indicator.
- Economic Indicators: Macroeconomic data releases provide insights into the broader economic environment. Key indicators include:
- Inflation Data (CPI, PPI): Rising inflation can erode purchasing power and profits, but the market’s reaction often depends on whether it’s seen as temporary or persistent, and how it might influence central bank policy.
- Employment Data (Jobs Report): Strong job growth signals a healthy economy with consumers who have money to spend. A weak report might signal a slowdown.
- Gross Domestic Product (GDP): The overall measure of economic output. Growth indicates expansion; contraction indicates recession risk.
- Consumer Confidence: How confident consumers feel about the economy and their personal finances impacts spending, which drives a large part of economic activity.
- Manufacturing and Service Sector Data (PMI): These indices indicate the health of different sectors of the economy.
- Interest Rates and Monetary Policy: Decisions by the Federal Reserve (or other central banks) on interest rates significantly impact the cost of borrowing for companies and consumers, the attractiveness of bonds versus stocks, and overall liquidity in the financial system. Lower rates generally support higher stock valuations, while rising rates can be a headwind.
- Geopolitical Events: Wars, political instability, trade disputes (like tariffs), and global crises can introduce uncertainty and volatility into the market.
- Industry Trends: Significant developments in major sectors represented in the S&P 500, such as technological innovation (like AI) or shifts in energy policy, can have a profound impact on the index constituents.
Technical Drivers: These relate to market sentiment, supply and demand within the market itself, and patterns observed in price and volume data.
- Supply and Demand: More buyers than sellers drive prices up; more sellers than buyers drive prices down. Simple, yet fundamental.
- Market Psychology/Sentiment: Fear and greed play massive roles. Bullish sentiment (optimism) can create self-fulfilling upward trends, while bearish sentiment (pessimism) can lead to panic selling.
- Technical Analysis Patterns: Traders use charts to identify trends, support and resistance levels, and chart patterns that they believe can predict future price movements. Moving averages, RSI, MACD, and Fibonacci retracements are just a few tools used.
- Liquidity: How easily assets can be bought and sold without significantly impacting the price. High liquidity in S&P 500 stocks and derivatives makes trading easier and reduces price volatility associated with large orders.
As you can see, the S&P 500 is not a simple entity. It’s a complex system influenced by forces both microscopic (individual company performance) and macroscopic (global economic trends, geopolitical shifts). For us as traders, our job is to analyze these forces and anticipate how they might collectively push the index in one direction or another.
Decoding Analyst Forecasts: US vs. European Outlooks
Given the S&P 500’s strong run, you might expect analysts to be universally bullish. However, one fascinating aspect of the current market landscape is the divergence in outlooks, particularly when comparing the U.S. market (represented by the S&P 500) with European equities (often benchmarked by the Stoxx Europe 600 Index, SXXP). This is where the picture gets more nuanced.
Interestingly, major financial institutions like JPMorgan Chase and Citi have recently put forth forecasts suggesting that European stocks may outperform the S&P 500 for the remainder of 2025. This is a significant call, especially after a period where U.S. tech-led growth has largely dominated global market returns.
Why this shift in perspective? These forecasts aren’t pulled out of thin air. They are typically based on extensive economic analysis, valuation comparisons, and anticipated shifts in global dynamics. The core rationale cited for the potential European outperformance often centers on an improving economic outlook in the EU. After navigating various economic headwinds, including energy crises and inflation pressures, the European economy is potentially entering a phase where growth is picking up, inflation is moderating, and corporate earnings are showing clearer signs of recovery or stability.
Specific forecasts from these institutions highlight their conviction:
- JPMorgan has set a target of 580 points for the Stoxx Europe 600 index. Crucially, their outlook involves a forecast for a decline in the S&P 500 from its recent highs. This isn’t just predicting European strength; it’s predicting relative weakness, or even a correction, in the U.S. market.
- Citi expects the Stoxx Europe 600 (SXXP) to reach 570 points this year. Their analysts point to increasing clarity on corporate earnings in Europe as a key driver for this anticipated performance. When there’s less uncertainty about how companies are doing financially, investors tend to become more confident.
These diverging forecasts present a challenge for S&P traders. Are the U.S. gains sustainable, or is a period of consolidation or decline indeed on the horizon, as some major banks predict? This kind of divergence underscores the importance of looking beyond headline index performance and considering the underlying analysis provided by experienced market strategists. It’s a reminder that markets are forward-looking, and current highs might be meeting expectations that future conditions may not fully support, at least in the view of some experts.
Why Some See Europe Outperforming the S&P 500
Let’s delve a little deeper into the reasoning behind the forecasts from institutions like JPMorgan and Citi suggesting that European equities could outperform the S&P 500 in the coming period. It’s not just about a feeling; it’s based on specific analytical points that highlight potential differences in the economic and market cycles between the U.S. and Europe.
One key argument is the relative position in the economic cycle. While the U.S. economy has shown remarkable resilience, some analysts believe it might be closer to a peak or slowdown phase, potentially impacted by factors like cumulative effects of higher interest rates or specific policy impacts. Europe, on the other hand, might be in an earlier phase of recovery or acceleration after facing steeper challenges. An improving EU economic outlook means better prospects for European companies’ revenues and profits.
Another factor is valuation. The S&P 500, particularly driven by the performance of a few mega-cap technology stocks, has reached historically high valuation levels based on metrics like Price-to-Earnings (P/E) ratios. European markets, overall, might be trading at lower valuations, making them appear relatively cheaper and more attractive to investors seeking value or expecting a rotation out of high-growth, high-valuation U.S. names.
Furthermore, the composition of indices matters. While the S&P 500 is heavily weighted towards technology and growth stocks, the Stoxx Europe 600 has a larger representation of sectors like financials, industrials, and consumer staples. If the global economic environment shifts from favoring pure growth at any cost to preferring value or more cyclical companies that benefit from economic recovery, European markets might be structurally better positioned to benefit.
Corporate earnings clarity, as mentioned by Citi, is also a significant point. Uncertainty is a major deterrent for investors. If European companies are providing clearer, more positive guidance on their future earnings, it reduces risk perception and can attract investment flows. After a period of uncertainty, any signs of stability or improvement can lead to a re-rating of equity values.
Finally, investor positioning could play a role. If a significant amount of global capital has flowed into the U.S. market, particularly into the leading S&P 500 stocks, there might be less room for further aggressive buying and potentially more risk of profit-taking. Conversely, if European markets have been relatively underowned or overlooked, there might be more potential for fresh capital to flow in.
These are complex arguments, and not all analysts agree. But understanding this contrasting perspective is vital. It encourages us to question whether the current S&P 500 rally is fully justified by future fundamentals or if it reflects sentiment that might shift, potentially towards overseas markets. As S&P traders, we must consider these global market dynamics and how shifts in capital flows could impact the index we focus on.
Economic Headwinds on the Horizon: Tariffs and Slowing Growth
Amidst the celebration of new S&P 500 highs, it’s crucial to also consider potential headwinds that could impact the market’s future trajectory. Not everyone believes the path forward will be smooth. One prominent voice highlighting potential risks is Ernst & Young (EY), a major global professional services firm whose economic analysis is closely watched.
EY has issued a warning that the current rally in the S&P 500 and broader equity markets might be exhibiting “unwarranted optimism” by potentially overlooking significant economic drags on the horizon. What are they concerned about? A major factor they point to is the impact of elevated tariffs. Tariffs, which are taxes on imported goods, have been a feature of global trade for several years, and recent policy decisions can either maintain or increase these barriers.
How do tariffs impact the economy and, consequently, the stock market? EY’s analysis suggests that tariffs will likely pressure household demand in the U.S. When goods imported from other countries face higher taxes, the cost is often passed on to consumers in the form of higher prices. This reduces consumers’ purchasing power – effectively, they can buy less with the same amount of money. If consumers cut back on spending, it impacts the revenues and profits of companies, many of which are listed in the S&P 500.
Furthermore, tariffs contribute to driving prices up – a form of cost-push inflation. While the Federal Reserve has been battling inflation through interest rate hikes, tariffs can make this fight harder by adding price pressures from the supply side. This can force the Fed to keep rates higher for longer, which, as we know, can be a negative for equity valuations.
EY also forecasts that the U.S. economy is expected to lose momentum significantly. They project the economy could approach “stall speed” in the fourth quarter of 2025, forecasting a low GDP growth rate of just 0.6% year-over-year for that period. “Stall speed” is an aviation term referring to the point where an aircraft loses sufficient speed to maintain lift; in economics, it describes growth so slow that the economy is highly susceptible to tipping into recession from any negative shock.
The core of EY’s warning is that the current S&P 500 valuation might not adequately reflect the potential economic slowdown and the negative impact on corporate profits that could result from these factors, particularly the drag from elevated tariffs. They argue that the market is pricing in a more optimistic economic future than their analysis suggests is likely.
For S&P traders, this perspective is a critical counterpoint to the current bullish sentiment. It highlights the importance of looking beyond the current price action and considering the longer-term fundamental risks that could derail the rally. It pushes us to ask: Is the market correctly pricing in these potential headwinds, or is there indeed “unwarranted optimism”?
Key Economic Reports S&P Traders Must Watch
Given that economic indicators are powerful drivers of the S&P 500, astute traders keep a close eye on key data releases. These reports can confirm or contradict prevailing market narratives and trigger significant price movements. Knowing when these reports are scheduled and what they might reveal is fundamental to managing risk and identifying potential trading opportunities.
Several major economic reports are consistently highlighted as market movers. Based on recent information, upcoming reports that could specifically influence the stock market include:
- Corporate Earnings Reports: While not a single “economic report” in the traditional sense, quarterly earnings releases from major S&P 500 companies are paramount. For example, Wells Fargo’s earnings were noted as a potential driver in the week ahead. The aggregate performance and forward guidance from key companies provide a direct look at the health of the businesses that make up the index.
- Inflation Data:
- Consumer Price Index (CPI): Measures the average change over time in the prices paid by urban consumers for a market basket of consumer goods and services. This is the primary gauge of inflation from the consumer’s perspective.
- Producer Price Index (PPI): Measures the average change over time in the selling prices received by domestic producers for their output. This is often seen as an indicator of future consumer inflation, as producer costs can be passed on to consumers.
Movements in CPI and PPI heavily influence expectations about the Federal Reserve’s interest rate policy, which in turn impacts equity valuations.
- Employment Data:
- The Jobs Report (Non-Farm Payrolls): This monthly report provides crucial data on employment levels, wage growth, and unemployment rates. A strong job market suggests consumer spending power and economic health, while a weak report can signal a slowdown.
The health of the labor market is a key input for both economic growth forecasts and central bank decisions.

Why are these specific reports so critical? They provide concrete data points that either validate or challenge the economic assumptions baked into current stock prices. If inflation data comes in higher than expected, it might reinforce fears of persistent price pressures and the need for tighter monetary policy. If the jobs report is much weaker than anticipated, it could fuel concerns about an impending recession. Conversely, positive surprises in these reports can provide fresh impetus for the market rally.
As a trader, it’s not enough to just know the report is coming. You need to understand what the consensus forecast is (what the market *expects* the number to be) and be prepared for potential volatility if the actual number deviates significantly from that expectation. This is where having access to real-time economic calendars and news feeds becomes invaluable. Trading around major economic releases requires careful planning, as market reactions can be swift and sharp.
Integrating Fundamental and Technical Analysis for S&P Trading
Successful S&P 500 trading rarely relies on just one form of analysis. The most effective approaches often involve integrating both fundamental and technical perspectives. Think of it as using two different lenses to view the same landscape – each provides crucial information that the other might miss.
Fundamental analysis, as we’ve discussed, focuses on the underlying value and health of the index based on economic conditions, industry trends, and corporate performance. It helps answer questions like: “Is the S&P 500 currently overvalued or undervalued based on expected earnings and economic growth?” or “Are macroeconomic risks like tariffs likely to impact companies in the index negatively?” Fundamental analysis gives you the *why* behind potential long-term movements.
Technical analysis, on the other hand, ignores the underlying fundamentals and focuses purely on price and volume data. It helps answer questions like: “What is the current trend?” “Where are the key support and resistance levels?” “Is momentum strengthening or weakening?” Technical analysis gives you the *when* and *how* of market movements – identifying entry and exit points, trend strength, and potential reversals based on market behavior patterns.
Here’s how you can integrate them:
- Use Fundamentals for Direction and Context: Understand the major economic forces at play (inflation, growth forecasts, Fed policy) and analyst outlooks (like the US vs. Europe comparison). This helps you form a broader thesis. For instance, if fundamental analysis suggests potential economic headwinds (like EY’s tariff warning and growth slowdown forecast), you might adopt a more cautious stance or look for opportunities to trade on the short side during pullbacks, even if the short-term technical trend is up.
- Use Technicals for Timing and Risk Management: Once you have a fundamental view, use technical indicators and chart patterns to refine your entry and exit points. If you believe the S&P 500 is fundamentally overextended but the trend is still bullish, you might wait for a specific technical signal (like a bearish divergence or a break of a key support level) before considering a short position. Conversely, if fundamentals are strong, you might use technical analysis to find optimal entry points during dips within an uptrend.
- Confirm Signals: Look for instances where fundamental and technical signals align. If a major economic report comes out weaker than expected (fundamental signal) and the S&P 500 price breaks below a significant technical support level, it reinforces the bearish case. If strong earnings reports (fundamental) coincide with a bullish technical pattern (like a breakout above resistance), it strengthens the bullish signal.
- Be Aware of Divergences: Sometimes, fundamentals and technicals seem to contradict each other. For example, the market (technical) might continue to rally despite negative economic news (fundamental). This could signal that the market is optimistic about overcoming the challenges, or perhaps it’s a sign of irrational exuberance nearing an end. Recognizing these divergences is key to avoiding being blindsided.
Integrating these two approaches provides a more robust framework for decision-making. Fundamental analysis helps you understand the potential energy building up (or dissipating) in the market, while technical analysis helps you understand how that energy is currently being expressed in price action and identify the most opportune moments to act. It requires practice, but mastering this integration is a hallmark of experienced traders.
The Power of Data: How S&P Global and Others Inform Traders
In the world of finance, data is king. Access to accurate, timely, and comprehensive information is absolutely essential for making informed trading decisions. For anyone trading the S&P 500, understanding where the index data comes from and the broader ecosystem of financial information providers is crucial.
At the heart of the S&P 500 index itself is S&P Global. This is a massive organization that plays a foundational role in global financial markets. One of its key divisions is S&P Dow Jones Indices, which is responsible for calculating, maintaining, and licensing many of the world’s most important indices, including the S&P 500, the Dow Jones Industrial Average, and others. When you see the S&P 500 value, it is being calculated and disseminated by this entity based on real-time stock prices.
But S&P Global is far more than just index calculation. Its other divisions provide a wealth of data and analysis that is vital for fundamental research:
- S&P Global Market Intelligence: Provides extensive financial data, analytics, and research on companies, markets, and economies. Products like S&P Capital IQ Pro are used by professionals for in-depth analysis, company screening, valuation, and market monitoring. This is where you get detailed financial statements, analyst estimates, industry data, and more.
- S&P Global Ratings: Provides credit ratings for companies, governments, and securities. While perhaps less directly relevant to daily S&P 500 price action, these ratings offer insights into the financial health and risk profile of companies within the index.
- S&P Global Commodity Insights: Provides data and analysis on energy, metals, agriculture, and other commodities. This can be relevant as commodity price movements can impact input costs for S&P 500 companies and influence overall economic indicators like inflation.
- S&P Global Sustainable1: Focuses on ESG (Environmental, Social, and Governance) data and insights, which are increasingly important factors for investors assessing long-term risk and opportunity. Products like SPICE (S&P ESG Data Index Source) fall under this division.
Beyond S&P Global, a vast ecosystem of financial news outlets and data providers contribute to the information flow:
- Financial News Networks (e.g., CNBC, Bloomberg): Provide real-time market quotes, breaking news headlines, expert commentary, and coverage of economic reports and corporate earnings. CNBC.com’s dedicated S&P 500 page (.SPX) is a common source for key stats and news. Bloomberg is known for its comprehensive data terminals and multimedia coverage.
- Analyst Platforms (e.g., TipRanks): Aggregate analyst ratings and forecasts, offering insights into the sentiment and price targets from Wall Street professionals.
- General Financial News Sites (e.g., Yahoo! Finance, Reuters, Wall Street Journal): Offer broad coverage of market news, economic developments, and company-specific stories.
For an S&P trader, accessing and processing this flow of information is a continuous process. It’s about piecing together the puzzle from various sources – the raw index data, the fundamental company and economic data, the analyst interpretations, and the market news. Effective trading requires not just having the data but knowing how to filter it, verify it, and integrate it into your trading strategy. It’s a significant part of the “edge” that successful traders develop.
Navigating Market Volatility: Strategies for S&P Traders
The S&P 500, while often viewed as a steady representation of the market, can experience periods of significant volatility. New record highs can quickly be followed by sharp pullbacks, driven by unexpected economic data, geopolitical events, or shifts in sentiment. Navigating this volatility effectively is key to long-term success as an S&P trader. It requires a combination of planning, discipline, and risk management.
What strategies can help you handle volatility?
- Define Your Trading Plan: Before you enter any trade, know your entry criteria, your exit strategy (both for profit and loss), and your position size. A well-defined plan helps prevent emotional decisions driven by sudden market swings.
- Manage Your Risk: This is paramount.
- Position Sizing: Determine how much capital you are willing to risk on any single trade. A common rule of thumb is risking only a small percentage (e.g., 1-2%) of your total trading capital on one position.
- Stop-Loss Orders: Always use stop-loss orders to automatically close your position if the market moves against you beyond a certain point. This limits your potential downside.
Volatility increases the importance of tight risk management, as unfavorable moves can happen very quickly.
- Understand the News Cycle: Be aware of upcoming major economic releases (like CPI, Jobs report, GDP) and corporate earnings dates. These are often catalysts for volatility. You might choose to reduce position size or even stay out of the market entirely around these events if you are risk-averse, or specifically plan strategies to capitalize on the expected volatility.
- Diversify (Where Applicable): While you are focusing on the S&P 500, understand how it correlates with other assets. If you trade other instruments, ensure you aren’t overly concentrated in assets that all move in the same direction based on the same factors.
- Consider Hedging: More advanced traders might use options or other derivatives to hedge their S&P 500 positions against potential downturns. For example, buying put options on an S&P 500 ETF could offer some protection if the index declines.
- Maintain Emotional Discipline: Volatility can trigger fear when prices drop and greed when they rise. Sticking to your trading plan and avoiding impulsive decisions based on short-term price swings is critical. Remind yourself why you entered the trade based on your analysis, not the day’s headlines.
- Adapt Your Strategy: In periods of high volatility, trend-following strategies might experience more whipsaws, while range-bound or mean-reversion strategies might become more effective, and vice-versa. Be prepared to adjust your approach based on the prevailing market characteristics.
Navigating volatility isn’t about avoiding it entirely – it’s a natural part of the market. It’s about having the tools, the plan, and the discipline to manage the risks it presents while potentially capitalizing on the opportunities it creates. It requires a calm mind and a systematic approach, even when the market is anything but calm.
Potential Trading Instruments for the S&P 500
As an S&P trader, you have several avenues available to gain exposure to the movements of this benchmark index. The choice of instrument often depends on your trading style, capital size, risk tolerance, and objectives (e.g., short-term speculation vs. long-term investment).
Here are some common ways to trade or invest in the S&P 500:
- S&P 500 Index Funds and ETFs: These are pooled investment vehicles that hold stocks in the same proportion as the S&P 500 index. Buying shares in an S&P 500 ETF (Exchange Traded Fund) like SPY, IVV, or VOO is one of the most popular ways for investors to track the index’s performance. ETFs are typically used for longer-term investing or swing trading due to brokerage costs and settlement times, though they can be traded actively.
- S&P 500 Futures Contracts: These are agreements to buy or sell the value of the S&P 500 index at a specific price on a future date. Futures are highly leveraged instruments commonly used by active traders and institutions for speculation or hedging. They offer direct exposure to index movements but come with significant risk due to leverage. The E-mini S&P 500 future (ES) is particularly popular.
- S&P 500 Options: Options contracts (calls and puts) give the buyer the *right*, but not the obligation, to buy or sell the S&P 500 index (or an S&P 500 ETF) at a specific price (strike price) before a certain date (expiration). Options are versatile and can be used for speculation, hedging, or generating income, offering defined risk for the buyer of the option premium.
- S&P 500 Contracts for Difference (CFDs): CFDs are derivative products that allow you to speculate on the price movement of the S&P 500 index without owning the underlying asset. When you trade an S&P 500 CFD, you are entering into a contract with a broker to exchange the difference in price from the time the contract is opened until it is closed. CFDs are leveraged products popular among short-term traders due to their flexibility, ability to trade both rising (long) and falling (short) markets easily, and often lower transaction costs compared to traditional stock trading or futures for smaller position sizes.
Each instrument has its own characteristics, advantages, and disadvantages regarding leverage, margin requirements, fees, and contract specifications. CFDs, for instance, offer high leverage and are often used for intraday or swing trading the index’s movements. Futures are also highly leveraged but involve larger contract sizes. ETFs are less leveraged and are generally better suited for position trading or long-term accumulation.
Choosing the right instrument depends on your trading goals and risk profile. If you’re focused on speculating on the index’s price movements over short to medium timeframes and are comfortable with leverage, instruments like CFDs or futures might be suitable. If you’re aiming for long-term investment exposure with less leverage, ETFs are often preferred.
If you’re considering trading CFDs on indices or exploring various other financial instruments, selecting a platform that offers a wide range of assets and robust trading tools is important. Finding a broker that supports your preferred trading style and provides necessary resources is a key step.
If you’re considering exploring trading various instruments like indices, commodities, or currencies through CFDs, then finding a platform that aligns with your needs is crucial. Moneta Markets is a platform that could be worth considering, particularly if you are interested in CFD trading. Hailing from Australia, they offer access to over 1000 financial instruments, catering to different types of traders.
Applying Data to Strategy: Putting It All Together
We’ve covered the S&P 500’s recent performance, looked at contrasting analyst outlooks, explored potential economic risks like tariffs and slowing growth, identified key economic reports to watch, and discussed different trading instruments. Now, how do we synthesize all this information into actionable trading strategies?
This is where the art and science of trading come together. It’s not just about collecting data; it’s about interpreting it within the context of your own trading framework and risk tolerance.
Consider the current environment based on the data points we’ve discussed:
- Current State: The S&P 500 is at or near all-time highs, indicating strong recent momentum and bullish sentiment.
- Analyst Outlooks: Major banks forecast potential European outperformance and a possible decline in the S&P 500, based on improving EU economy and potential U.S. headwinds/valuations.
- Economic Risks: Warnings about tariffs impacting demand and potentially leading to significantly slower GDP growth in late 2025 are present.
- Upcoming Catalysts: Key economic reports (CPI, PPI, Jobs) and earnings releases are scheduled, which could confirm or contradict current market pricing and forecasts.
As an S&P trader, you might ask yourself:
- Given the current highs, is the market overextended? Technical indicators might help answer this by showing momentum or potential resistance.
- How much has the market already priced in the “improving EU outlook”? If European markets surge after analyst calls, perhaps that view is gaining traction.
- Are traders fully appreciating the potential impact of tariffs and a significant slowdown in late 2025? EY suggests not, implying a potential for negative surprises down the line.
- How are upcoming economic reports likely to influence this balance of optimism and caution? A hot CPI print might reinforce fears of persistent inflation and rate worries, potentially pressuring the market. A weak jobs report might bring recession fears back to the forefront.
Your strategy could involve:
- Trend Following with Caution: Acknowledge the strong uptrend (from performance data) but be mindful of potential reversal signals (from technical analysis) and fundamental warnings (from analyst outlooks and economic risks). Tighten stop-losses or reduce position sizes as the index reaches new highs, anticipating potential volatility or pullbacks if negative news or shifting sentiment emerges.
- Trading Key Reports: Develop strategies specifically for major economic releases. This could involve trading options strategies that profit from increased volatility, or waiting for the initial reaction and then trading the subsequent trend if a clear direction emerges.
- Relative Strength Trading: Pay attention to the relative performance of the S&P 500 compared to other indices like the Stoxx Europe 600. If European markets start showing sustained outperformance, it might confirm the analyst forecasts and suggest a rotation of capital, potentially acting as a subtle warning sign for continued strength in the S&P 500.
- Considering Downside Protection: Given the warnings about potential future slowdowns and risks, consider strategies that offer downside protection, such as buying put options or employing strategies that allow for short positions, if you are comfortable with them. CFDs, for instance, make going short on the S&P 500 index relatively straightforward.
Ultimately, applying data to strategy is an ongoing process of analysis, planning, execution, and review. It’s about using the information provided by sources like S&P Global, news outlets, and analyst reports to inform your fundamental understanding, and then using technical analysis and risk management tools to execute your trades effectively in a volatile market.
For traders looking to access diverse global markets and utilize various trading platforms, including the popular MT4 and MT5, exploring broker options that offer these capabilities is a practical step. Moneta Markets supports platforms like MT4, MT5, and their own Pro Trader, combined with features like high-speed execution and low spreads, which are important for managing costs and executing strategies effectively, particularly for short-term S&P CFD trading.
The Role of AI and Technology in Modern S&P Trading
The financial world, including S&P 500 trading, is being increasingly shaped by advancements in technology, particularly Artificial Intelligence (AI). While AI itself is a trending topic that can impact specific stocks (especially tech giants within the S&P 500), AI and related technologies are also transforming the *process* of trading and analysis.
How is technology influencing S&P trading?
- Algorithmic Trading & High-Frequency Trading (HFT): A significant portion of S&P 500 trading volume is now executed by algorithms, including HFT systems that make decisions and execute trades in fractions of a second. These algorithms react instantly to news, data releases, and price changes, contributing to market liquidity but also capable of exacerbating volatility during rapid movements.
- Enhanced Data Analysis: AI and machine learning are being used to process vast amounts of financial data from sources like S&P Global Market Intelligence, news feeds, social media, and even satellite imagery to identify patterns and generate trading signals that might be invisible to human analysis alone. This includes predicting market movements, analyzing sentiment, and identifying correlations.
- Improved Trading Platforms and Tools: Modern trading platforms offer sophisticated charting tools, backtesting capabilities (testing strategies on historical data), automated trading features (allowing algorithms to execute trades based on predefined rules), and advanced order types. Platforms like MT4, MT5, and Pro Trader, mentioned earlier, integrate many of these capabilities.
- Access to Information: Technology provides retail traders with access to real-time data, news, and analytical tools that were once exclusive to institutional players. Services like S&P Capital IQ Pro (though often premium) and platforms aggregating news and analyst ratings level the playing field somewhat.
- Natural Language Processing (NLP) in Sentiment Analysis: AI-powered NLP can scan thousands of news articles, social media posts, and analyst reports to gauge the overall market sentiment towards the S&P 500 or specific sectors/stocks, providing insights into market psychology on a large scale.
For the individual S&P trader, this technological evolution means both challenges and opportunities. The challenge lies in competing with sophisticated algorithms. The opportunity lies in leveraging available technology to enhance your own analysis and execution. You might not be running an HFT system, but you can use automated charting tools, backtest your strategies rigorously, set up alerts for key technical levels or news events, and use platforms that offer fast execution to minimize slippage.
Furthermore, understanding AI as a *market theme* is important. The performance of S&P 500 companies involved in AI development (like Microsoft, NVIDIA, etc.) has been a significant driver of the index’s recent gains. Keeping abreast of developments and investment trends within AI is a fundamental aspect of analyzing the prospects for a large portion of the S&P 500 index. Technology isn’t just a tool for trading the S&P 500; it’s also a key factor driving the performance of the index itself.
Conclusion: What the Future May Hold for the S&P 500 Trader
The S&P 500 index stands at a fascinating juncture. Its recent climb to record highs reflects a period of significant optimism and strong performance over the past year. The raw data confirms this strength, showcasing substantial year-to-date and one-year gains. This performance has been fueled by various factors, including corporate earnings and a general perception of economic resilience.
However, as we’ve explored, the path forward appears anything but certain and is influenced by a confluence of competing forces. While momentum is strong, cautious outlooks from major financial institutions like JPMorgan and Citi suggest that other markets, particularly European equities, may offer relatively better performance prospects ahead. Their analysis points to an improving economic picture in the EU contrasting with potential headwinds for the U.S. market.
Adding to this caution are warnings from experts like Ernst & Young, who highlight potential economic risks that may not be fully priced into the current S&P 500 valuation. Elevated tariffs, the potential for pressured household demand, and a forecast for significantly slower U.S. GDP growth in late 2025 are factors that warrant serious consideration. These are fundamental risks that could challenge the sustainability of the current rally.
For you, the S&P trader, navigating this dynamic environment requires vigilance and a comprehensive approach. Relying solely on the recent upward trend without considering the underlying economic analysis and potential risks could be perilous. Conversely, becoming overly bearish based on warnings without acknowledging the current market strength and positive drivers could lead to missing opportunities.
The key takeaways are clear: Stay informed on upcoming major economic reports and corporate earnings, as these will be critical in confirming or contradicting the various outlooks. Pay attention to analyst revisions and the performance of other global indices to gauge potential shifts in capital flows and sentiment. Integrate fundamental analysis (understanding the ‘why’ from economic data and forecasts) with technical analysis (understanding the ‘how’ and ‘when’ from price action) to inform your trading decisions.
Leveraging reliable data sources, whether from S&P Global’s extensive offerings or financial news outlets, is non-negotiable. Your trading platform’s capabilities in providing data, analysis tools, and efficient execution are also vital assets in this complex landscape. Remember that effective risk management is your most important tool, especially in potentially volatile periods.
The future trajectory of the S&P 500 will be shaped by how these competing forces play out. Will the current momentum continue, powered by strong earnings and resilient sentiment? Or will the predicted economic headwinds and shifts in global capital flows lead to a correction or a period of underperformance relative to other markets? By remaining analytical, disciplined, and adaptable, you can position yourself to navigate these possibilities and make informed decisions on your trading journey.
| Economic Indicators | Impact on S&P 500 |
|---|---|
| Consumer Price Index (CPI) | Indicates inflation trends; higher CPI can lead to fears of rate hikes. |
| Producer Price Index (PPI) | Measures inflation from the perspective of producers; signals future cost pressures. |
| Jobs Report (Non-Farm Payrolls) | Reflects employment health; strong reports boost confidence, weak ones signal slowdown. |
s&p traderFAQ
Q:What is the S&P 500?
A:The S&P 500 is a stock market index that measures the stock performance of 500 of the largest companies listed on stock exchanges in the United States.
Q:How can I invest in the S&P 500?
A:You can invest in the S&P 500 through index funds, ETFs (Exchange Traded Funds), futures, or options related to the index.
Q:What economic indicators should I watch for S&P 500 trading?
A:The most important indicators include CPI, PPI, and unemployment rates, as these can significantly affect market movements and investor sentiment.