Mastering Fibonacci Retracements: How to Draw and Trade Pullbacks in an Uptrend
Welcome, fellow navigators of the financial markets. Today, we embark on a journey to understand one of the most revered tools in technical analysis: Fibonacci retracement. Derived from a mathematical sequence found throughout nature, these levels offer a unique perspective on potential support and resistance, helping us anticipate price movements. Whether you’re new to trading or seeking to refine your approach, understanding how to properly draw and utilize Fibonacci retracements, especially in the context of an uptrend, is a fundamental skill that can significantly enhance your trading edge.
Think of Fibonacci retracements not as a crystal ball, but as a map. A map that highlights key junctures where price might pause, reverse, or accelerate. In this guide, we will delve into the origins of these fascinating numbers, break down exactly what Fibonacci retracement levels represent, provide a step-by-step method for drawing them specifically on an uptrend chart, and discuss strategies for trading pullbacks using these levels. We’ll also touch upon how to combine this powerful tool with others to build a more robust trading plan. So, let’s begin uncovering the secrets these ancient ratios hold for modern markets.
The Foundation: Unveiling the Secrets of Fibonacci and the Golden Ratio
Before we dive into charting, let’s appreciate the profound mathematical basis behind Fibonacci analysis. It all begins with the Fibonacci sequence, discovered by Leonardo of Pisa (Fibonacci) in the 13th century. This sequence starts with 0 and 1, and each subsequent number is the sum of the two preceding ones: 0, 1, 1, 2, 3, 5, 8, 13, 21, 34, 55, 89, and so on, extending to infinity.
While the sequence itself might seem simple, the magic lies in the ratios derived from it. As you move further along the sequence, the ratio of any number to the next higher number approaches approximately 0.618 (e.g., 34/55 ≈ 0.618). This number, 0.618, is known as the Golden Ratio or Phi (Φ). Conversely, the ratio of any number to the next *lower* number approaches approximately 1.618 (e.g., 55/34 ≈ 1.618).
These ratios extend further. The ratio of a number to the number two places higher approaches 0.382 (e.g., 34/89 ≈ 0.382). The ratio of a number to the number three places higher approaches 0.236 (e.g., 21/89 ≈ 0.236). These specific ratios – 23.6%, 38.2%, 61.8% – along with the 50% level (which is not strictly a Fibonacci ratio but is widely accepted due to its importance in Dow Theory and general market behavior, representing a perfect midpoint), form the core Fibonacci retracement levels used in technical analysis.
Why are these ratios relevant to financial markets? Proponents believe that these universal mathematical relationships influence human behavior and, consequently, market psychology. Just as these ratios appear in natural phenomena like shell spirals, hurricane shapes, and even the proportions of the human body, they are thought to manifest as key turning points or areas of consolidation on price charts. Price movements, driven by collective investor sentiment, are argued to often retrace a predictable percentage of a previous move before continuing in the original direction. Identifying these percentages provides traders with potential areas of interest for entry or exit.
| Fibonacci Level | Description |
|---|---|
| 23.6% | Often a shallow retracement, suggesting a strong trend. |
| 38.2% | A frequently watched level indicating good trend strength. |
| 50% | Critical psychological level for traders anticipating a reaction. |
| 61.8% | Known as the “Golden Ratio” retracement and vital in analysis. |
| 78.6% | Indicates trend weakening; yet may still lead to trend continuation. |
Fibonacci Retracements: Identifying Key Levels in Trends
Now that we understand the mathematical backbone, let’s focus on Fibonacci retracements themselves. These are horizontal lines plotted on a price chart that indicate potential support and resistance levels at the key Fibonacci percentages (23.6%, 38.2%, 50%, 61.8%, 78.6%) of a previous price move. Their primary purpose is to analyze pullbacks or corrections that occur within an existing trend.
Imagine a stock price moving strongly upwards (an uptrend). Eventually, some traders will take profits, or new sellers will enter, causing the price to dip downwards temporarily – this is a pullback or correction. The question every trend trader asks is: “How far will this pullback go before the original uptrend resumes?” Fibonacci retracement levels aim to provide potential answers to this question.
The common Fibonacci retracement levels are:
- 23.6%: Often a shallow retracement. If price bounces here, it suggests a very strong trend.
- 38.2%: A frequently watched level. A bounce here indicates good trend strength.
- 50%: While not a true Fibonacci number, it’s a critical psychological and technical level, representing a perfect 50% correction of the prior move. Many traders expect price to react here.
- 61.8%: Known as the “Golden Ratio” retracement. This is arguably the most significant Fibonacci level. A deep pullback to 61.8% is still considered a valid retracement within a strong trend.
- 78.6%: This level is derived from the square root of 0.618. A retracement to 78.6% is quite deep and might suggest the trend is weakening, though it can still precede a continuation. Some charting platforms also include 70.7% (square root of 0.50), another common deep retracement level.
These levels are plotted between two significant price points: a swing high and a swing low. A swing high is typically a peak price point on a chart where the price trend temporarily reverses downwards. A swing low is a trough price point where the trend temporarily reverses upwards. Identifying these significant swings is crucial for accurately drawing the retracements.
Once drawn, these horizontal lines represent areas where buying pressure (in an uptrend) or selling pressure (in a downtrend) is anticipated to potentially resume dominance, halting the correction and continuing the main trend. They act as potential magnets or barriers for price.
Step-by-Step Guide: Drawing Fibonacci Retracements in an Uptrend
Okay, let’s get practical. You’ve identified an asset that is clearly in an uptrend. You see a strong move up, followed by a recent pullback. Now, you want to use Fibonacci retracement to find potential support levels where the pullback might end and the uptrend could continue. Here’s how you draw the Fibonacci retracement tool correctly on your charting software:
Step 1: Identify the Significant Trend
Ensure the asset is truly in a recognizable uptrend. This means you see a series of higher highs and higher lows over a period you are interested in trading (e.g., if you day trade, look at 15-minute or 60-minute charts; if you swing trade, look at daily or weekly charts).
Step 2: Locate the Significant Swing Low
Find the starting point of the recent strong upward move. This is typically the lowest point *before* the significant rally began. This will be your 0% level.
Step 3: Locate the Significant Swing High
Find the highest point reached *after* the swing low you identified in Step 2, but *before* the current pullback started. This is the peak of the move you are analyzing. This will be your 100% level.
Step 4: Select the Fibonacci Retracement Tool
Most charting platforms (like TradingView, MT4/MT5, or platform-specific ones) have a dedicated Fibonacci retracement tool. Select it from your drawing tools menu.
Step 5: Draw the Retracement
This is the critical step for an uptrend:
- Click precisely on the Significant Swing Low (the starting point of the rally, which represents 0%).
- Hold down your mouse button.
- Drag the cursor upwards to the Significant Swing High (the peak of the rally, which represents 100%).
- Release the mouse button.
Your charting software will then automatically draw horizontal lines across your chart at the standard Fibonacci retracement levels (23.6%, 38.2%, 50%, 61.8%, 78.6%) between your chosen swing low and swing high. These lines extend horizontally to the right, projecting potential future support areas during the current pullback.
Understanding this process is key. In an uptrend, you are measuring the *previous upward move* to anticipate where a *downward correction* might find support. Therefore, you draw from the *bottom* (swing low, 0%) to the *top* (swing high, 100%). This is the opposite of drawing in a downtrend, where you would draw from the swing high (0%) down to the swing low (100%) to anticipate resistance during a bounce.
Getting the swing points right is fundamental. What constitutes a “significant” swing? This can be subjective, but generally, look for clear pivots on the chart that stand out and initiated substantial price moves. Using multiple timeframes can help confirm the significance of a swing point; a swing high/low visible on a daily chart is often more significant than one only visible on a 5-minute chart.
Navigating the Subjectivity: Choosing the Right Swing Points
While the drawing process itself is mechanical once you select the tool, the decision of *which* swing low and swing high to connect is where subjectivity creeps into Fibonacci analysis. This is perhaps the most challenging aspect for many traders.
Consider a typical price chart. There might be several minor highs and lows within a larger move. Which ones do you choose? A common pitfall is drawing Fibonacci levels on every little wiggle, which can clutter your chart and provide too many conflicting signals.
The key is to identify the swings that initiated or ended a *significant* price movement. Look for clear changes in direction that resulted in substantial price change relative to the timeframe you are analyzing. For instance, on a daily chart, you would look for multi-day or multi-week highs and lows. On an hourly chart, you might focus on swings that mark the beginning or end of moves lasting several hours.
Sometimes, you might see multiple valid swing-high/swing-low pairs that could be used. In such cases, you might draw multiple Fibonacci grids on the same chart. This can sometimes show areas where levels from different grids converge, creating potential confluence – an area where multiple technical indicators point to the same outcome. Confluence significantly increases the potential reliability of a support or resistance zone.
Practicing on historical data is essential here. Go back and look at charts where significant pullbacks occurred. Experiment with drawing Fibonacci retracements from different potential swing points that preceded the pullback. See which set of levels seemed to correspond best with where the price actually found support. You’ll develop an eye for identifying the most relevant swings over time.
Remember, Fibonacci levels are not magic lines that price will *always* bounce off perfectly. They are *potential* areas of interest. Price can overshoot or undershoot these levels. The goal is to identify zones where the probability of a reaction is higher.
| Common Challenges | Description |
|---|---|
| Subjectivity in Swing Points | Choosing the right swing high and low can vary between traders. |
| Markets Aren’t Always Perfect | Price may not respond exactly to Fibonacci levels. |
| Over-reliance | Ignoring overall market context can lead to faulty conclusions. |
Trading with Fibonacci Retracements in an Uptrend: Strategy & Confluence
Once you have correctly drawn your Fibonacci retracement levels on an uptrend chart, you now have a set of potential support zones. How do you use these in your trading strategy?
The basic idea is to look for buying opportunities when the price pulls back to one of these key Fibonacci support levels during an uptrend. The expectation is that the primary uptrend will resume after the correction finds support at one of these percentages.
Common trading strategies include:
- Buying at a Specific Level: You might decide to place a limit buy order slightly above a key level like the 38.2%, 50%, or 61.8% retracement, anticipating a bounce.
- Waiting for Confirmation: A more conservative approach is to wait for price action confirmation at a Fibonacci level. This could involve looking for bullish candlestick patterns (like a hammer or bullish engulfing) or a clear turn back upwards from the level on a lower timeframe.
- Combining with Other Indicators (Confluence): This is often the most powerful way to use Fibonacci levels. Instead of relying solely on a Fibonacci line, look for instances where a Fibonacci level aligns with other technical support indicators. For example, if the 50% retracement level of a rally coincides with a long-term uptrend line, a major moving average (like the 50-period or 200-period MA), or a previous area of price congestion (support), this area of confluence is likely to be a much stronger support zone than the Fibonacci level alone.
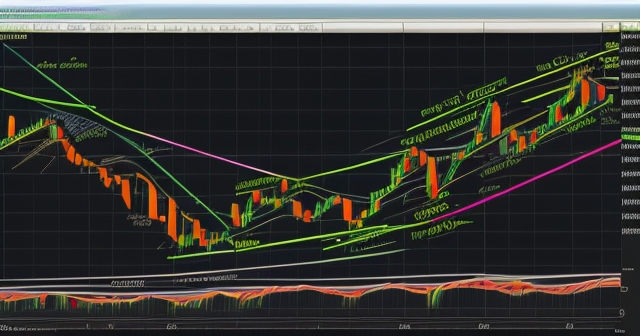
Let’s illustrate confluence with an example. Imagine you are looking at a stock chart in a strong uptrend. You draw your Fibonacci retracement from the recent swing low to the swing high. You see the 61.8% Fibonacci level is at $150. You then notice that the 200-day moving average for the stock is also currently trading at $150. Furthermore, looking left on the chart, you see that $150 was a previous resistance level that was broken, which now should ideally act as support (a principle known as “support becomes resistance, resistance becomes support”). When multiple indicators like a Fibonacci level, a moving average, and a historical support/resistance level all converge at the same price point, this creates powerful confluence. A pullback to $150 in this scenario presents a high-probability buying opportunity.
Which level is the “best” to trade off? There’s no single answer. The 38.2%, 50%, and 61.8% levels are generally considered the most significant. Shallow retracements to 23.6% suggest extreme strength, while deep retracements to 78.6% might indicate waning momentum. Experienced traders often pay close attention to the 61.8% level due to its connection to the Golden Ratio.
Setting Stop Losses and Take Profits with Fibonacci
Fibonacci levels are not just for entries; they are invaluable for risk management and setting price targets.
Stop Losses: If you enter a long trade banking on a bounce off a Fibonacci support level (e.g., the 61.8% level at $150), it’s prudent to place your stop-loss order below that level. Placing it slightly below the 61.8% ($150) or perhaps below the next Fibonacci level down (e.g., below 78.6% or even below the original swing low at 0%) helps protect your capital if the price fails to find support and breaks convincingly below the expected retracement level. A break below a significant Fibonacci support level suggests the uptrend might be over or pausing for a deeper correction than anticipated.
Take Profits: Fibonacci extensions are typically used to project potential price targets *beyond* the initial swing high (100% level). However, even using retracements, you can set initial targets. For instance, if you bought at the 61.8% retracement, your first target might be the 38.2% level, then the 23.6% level, and finally the original swing high at the 100% level. Breaking convincingly above the 100% level confirms the continuation of the uptrend and opens the door for using Fibonacci extensions for further targets.
Integrating Fibonacci levels into your risk management framework is crucial. It provides a logical, mathematically based method for determining where to enter, where to exit for profit, and crucially, where to cut losses if the trade doesn’t work out as expected. This structured approach helps remove emotion from trading decisions.
Beyond Retracements: Introducing Fibonacci Extensions for Targets
While Fibonacci retracements help us find potential entry points during a pullback within an established trend, Fibonacci extensions are used to project potential price targets *after* the price breaks beyond the previous swing high (in an uptrend) or swing low (in a downtrend).
Extension levels are calculated using ratios derived from the Fibonacci sequence but extend *beyond* the 100% mark. Common extension levels include 138.2%, 161.8%, 200%, 261.8%, and sometimes even higher. They are typically drawn using a three-point process: from the swing low to the swing high, and then back to the end of the retracement (where the price bounced). The tool then projects the extension levels based on the length of the original swing and the retracement.
In an uptrend, once price has pulled back to a Fibonacci retracement level and then rallies, breaking decisively above the initial swing high (100%), Fibonacci extensions become valuable. They suggest potential future resistance levels where the extended rally might pause or reverse. For a trader who bought at a retracement level, these extension levels provide logical price targets for taking profits.
For instance, if you bought a stock at the 61.8% retracement level and the price has now moved above the previous swing high (100%), you might use Fibonacci extensions to see where the 161.8% extension lies. This level could serve as your primary take-profit target.
While slightly more complex to apply than retracements, understanding extensions gives you a tool for estimating the potential upside of a trend continuation, complementing the entry signals provided by the retracements.
Practical Considerations and Common Pitfalls
While powerful, using Fibonacci retracements effectively requires practice and awareness of some common challenges:
- Subjectivity in Swing Points: As discussed, choosing the “right” swing high and low is subjective. Different traders may draw different grids, leading to different potential levels. This is why confluence with other indicators is so important – it helps validate the significance of a particular Fibonacci level.
- Markets Aren’t Always Perfect: Price won’t always bounce exactly off a Fibonacci line. It might react slightly before, slightly after, or ignore the level altogether, especially in volatile or non-trending markets.
- Over-reliance: Relying solely on Fibonacci levels without considering the overall market context, trend strength, volume, and other technical or fundamental factors can be detrimental.
- Ignoring Timeframes: Fibonacci levels drawn on a daily chart are generally more significant than those drawn on a 5-minute chart. Always be aware of the timeframe you are analyzing and how it fits into the larger picture. A retracement on a short timeframe might only be a minor pause within a larger trend, while a retracement on a weekly chart could signal a major turning point.
- Curve Fitting: Avoid the temptation to redraw your Fibonacci levels *after* price has already reacted at a certain level, just to make it look like your analysis “worked.” Choose your swing points based on clear market structure *before* the pullback occurs.
Using Fibonacci tools is more art than science. It requires developing an intuitive feel for the market structure and understanding that these levels are probabilities, not certainties. It’s a tool to aid decision-making, not a guaranteed roadmap to profits.
Combining Fibonacci with Other Technical Tools
The true power of Fibonacci analysis is unlocked when it’s used in conjunction with other technical indicators and charting techniques. This concept of confluence is paramount in identifying high-probability trading setups. We touched upon it briefly, but let’s expand.
Imagine you’ve identified a potential buying opportunity on a Fibonacci retracement level in an uptrend. How can you strengthen your conviction for this trade? Look for other technical signals converging at or near that same level:
- Trend Lines: Does the Fibonacci level coincide with a long-standing upward-sloping trend line? The intersection of a horizontal Fibonacci level and a diagonal trend line creates a powerful support zone.
- Moving Averages: Are key moving averages (e.g., 50-day, 100-day, 200-day) located at or near your chosen Fibonacci level? Moving averages often act as dynamic support/resistance.
- Previous Support/Resistance: Look left on your chart. Was this Fibonacci level a previous swing high or low? Was it a level where price consolidated or reversed in the past? Previous resistance broken often becomes future support.
- Chart Patterns: Is the price action around the Fibonacci level forming a bullish chart pattern, such as a double bottom, head and shoulders bottom, or a bullish flag?
- Candlestick Patterns: As price approaches the Fibonacci level, are bullish reversal candlestick patterns forming (like hammers, engulfing patterns, or doji stars)? These can signal that buying pressure is entering the market at that level.
- Volume: Does volume pick up significantly as price reaches the Fibonacci support level, especially on upward price movements? Increasing volume on bounces from support can confirm buying interest.
| Technical Tool | Purpose |
|---|---|
| Trend Lines | Provide dynamic support/resistance zones. |
| Moving Averages | Help to identify trend direction and support/resistance levels. |
| Previous Support/Resistance | Indicate areas of past price reactions. |
When multiple signals align, the probability of the trade working out increases significantly. For example, if the 61.8% Fibonacci retracement level of an uptrend coincides with a major horizontal support zone, a rising 50-day moving average, and you see a bullish engulfing candle form right at that level on increasing volume, you have a high degree of confluence supporting a long entry.
This multi-indicator approach is a hallmark of experienced traders. It reduces reliance on any single tool and provides a more comprehensive view of the market’s structure and potential direction. Fibonacci retracement is a fantastic tool, but it works best when it’s part of a larger, well-defined trading system.
If you’re exploring different markets like Forex, finding a platform with robust charting tools is essential for performing this kind of technical analysis effectively.
If you’re looking for a broker that offers a wide range of tools and assets for your trading journey, Moneta Markets is worth considering. Based in Australia, they provide access to over 1000 financial instruments and support platforms like MT4, MT5, and Pro Trader, which are excellent for drawing and analyzing charts with tools like Fibonacci.
Applying Fibonacci in Different Markets and Timeframes
Fibonacci analysis, including drawing retracements in uptrends, can be applied across virtually all financial markets: stocks, indices, commodities, and foreign exchange (Forex). The underlying principle is the same: price action in trending markets tends to retrace a portion of the prior move based on these natural ratios before potentially continuing the trend.
Consider the Forex market, known for its distinct trends. If you’re trading a currency pair like AUD/JPY which is in a clear uptrend, you can apply the same swing low to swing high method on your desired timeframe. The Fibonacci levels will then highlight potential buy zones during a pullback.
The choice of timeframe is critical and depends on your trading style. If you are a short-term trader or day trader, you might look for Fibonacci retracement opportunities on 15-minute or 60-minute charts. If you are a swing trader or long-term investor, daily, weekly, or even monthly charts will be more relevant for identifying significant swings and retracements.
Using multiple timeframes in conjunction with Fibonacci can provide added conviction. For example, you might identify a long-term uptrend on a weekly chart. Then, you drop down to a daily chart to identify a recent strong swing up and the subsequent pullback. Drawing Fibonacci retracements on the daily chart might reveal a key level (like 61.8%) that also coincides with a major support zone identified on the weekly chart. This multi-timeframe alignment strengthens the potential trade setup.
Consistency in your approach across different timeframes is important. Always draw from the start of the identified move (swing low in an uptrend) to the end of that move (swing high in an uptrend) on the timeframe you are analyzing.
The Role of Experience and Practice
Mastering the art of drawing and trading with Fibonacci retracements, particularly in uptrends, is not something that happens overnight. It requires significant practice and screen time. Initially, you might struggle with identifying the “correct” swing points. You might draw lines that don’t seem to correlate with price behavior. This is a normal part of the learning curve.
Here are some tips for gaining experience:
- Backtesting: Go back through historical charts and practice drawing Fibonacci retracements on past uptrends. See how price reacted around the levels. Did it find support at 38.2%, 50%, or 61.8% before continuing higher? Note instances where it worked well and instances where it failed.
- Forward Testing (Simulated Trading): Use a demo or paper trading account to practice applying Fibonacci analysis in real-time market conditions without risking real money. This allows you to test your ability to identify swings, draw levels, and execute trades based on your analysis.
- Start Simple: Begin by focusing on obvious, strong trends and significant swings. Don’t try to apply Fibonacci to choppy or sideways markets, as the tool is less effective in those conditions.
- Review Your Trades: After every trade where you used Fibonacci analysis, review whether your swing point selection was appropriate and how price behaved relative to the levels you drew. What could you do better next time?
Developing a keen eye for significant swing points and understanding how price tends to interact with these mathematical levels takes time and effort. Don’t get discouraged if your initial attempts aren’t perfect. Every experienced trader went through this learning process.
As you gain experience, you’ll start to develop a feel for which swing points on a particular asset and timeframe are the most relevant for drawing your Fibonacci grids. You’ll also become more adept at identifying confluence zones and using Fibonacci levels as guides for setting entry, stop-loss, and take-profit levels within your broader trading strategy.
Choosing a platform that supports flexible charting and allows you to easily draw and customize these tools across various markets is beneficial for this practice. Many platforms offer tools for drawing Fibonacci retracements and extensions, but the user interface and accuracy can vary. Finding a reliable platform that fits your trading needs is part of the process.
Finding the right brokerage with robust charting tools and a wide range of tradable assets can make practicing technical analysis like Fibonacci retracements much easier. If you are trading internationally or focusing on Forex and CFDs, finding a broker with multiple regulations and diverse product offerings is often a priority. Moneta Markets, with licenses from regulators like FSCA, ASIC, and FSA, along with features like fund segregation and 24/7 support, aims to provide a secure and supportive environment for traders at various levels, which can be particularly helpful for those just starting out with technical analysis.
Final Thoughts: Integrating Fibonacci into Your Trading Arsenal
Fibonacci retracements are a fascinating and valuable tool for any technical trader, especially those focused on trending markets. Rooted in natural mathematical proportions, these levels offer a logical framework for anticipating potential areas of support during pullbacks in an uptrend and resistance during bounces in a downtrend.
By mastering the simple yet crucial skill of drawing Fibonacci retracements from the significant swing low (0%) to the swing high (100%) in an uptrend, you gain the ability to identify potential buy zones where the price correction might end and the primary trend could resume. Remember, the accuracy of your drawing depends entirely on your ability to identify the correct swing points – a skill honed through practice.
The real power of Fibonacci levels emerges when you use them in conjunction with other technical analysis tools. Looking for confluence – where a Fibonacci level aligns with a trend line, moving average, historical support zone, or bullish candlestick pattern – creates higher-probability trading setups. These levels also provide logical price points for setting stop-loss orders to manage your risk and take-profit targets using extensions.
While Fibonacci analysis is not a guaranteed predictor of future price movements, and markets can always behave unpredictably, incorporating it into your technical analysis toolkit provides a structured, probability-based approach to identifying potential trading opportunities and managing risk in trending markets. Continue to practice, refine your ability to identify significant swings, seek confluence, and use Fibonacci retracements as a guide to complement your overall trading strategy.
By approaching Fibonacci with discipline and integrating it wisely with other techniques, you can enhance your understanding of market structure and potentially improve your trading outcomes. Happy charting!
how to draw fibonacci retracement in uptrendFAQ
Q:What is the purpose of using Fibonacci retracement in trading?
A:Fibonacci retracement helps identify potential support and resistance levels during price pullbacks in an uptrend, allowing traders to anticipate possible reversals or continuations.
Q:How do I choose significant swing points for drawing Fibonacci?
A:Choose prominent highs and lows that mark substantial price moves, ensuring they visibly reflect important trends over the timeframe you’re analyzing.
Q:Can Fibonacci levels be used in all financial markets?
A:Yes, Fibonacci retracements can be utilized in various markets, including stocks, indices, commodities, and Forex, based on their fundamental principles of price action in trending markets.
