
Unveiling Heikin-Ashi: A Paradigm Shift in Candlestick Analysis
As aspiring or seasoned traders, we are constantly seeking an edge, a clearer lens through which to view the often-chaotic dance of market prices. Traditional candlestick charts, while foundational, can sometimes overwhelm us with their inherent choppiness, presenting a deluge of market noise that can obscure the true underlying trend. Have you ever felt lost amidst a sea of alternating red and green candles, unsure if a minor pullback signals a reversal or merely a fleeting pause?
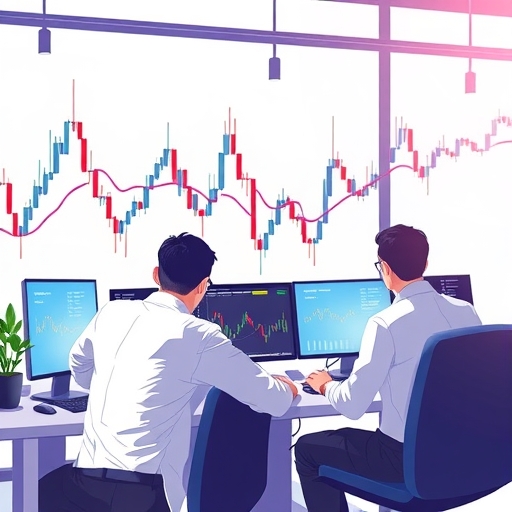
Enter Heikin-Ashi. Derived from the Japanese phrase meaning “average bar,” Heikin-Ashi is not just another charting overlay; it’s a sophisticated technical analysis technique designed to transform your perception of market dynamics. Its core purpose is to smooth out price action, making trends more discernible and reducing the prevalence of misleading false signals that can plague conventional candlestick analysis. By reconfiguring the raw price data through a unique averaging mechanism, Heikin-Ashi charts offer a tranquil, more insightful canvas, empowering us to identify and follow market momentum with unprecedented clarity. Imagine observing the subtle ebb and flow of a strong current rather than being caught in every ripple and wave. That’s the essence of the Heikin-Ashi advantage. We believe that by mastering this powerful tool, you can significantly enhance your decision-making processes, leading to more strategic entries and exits, and ultimately, more consistent profitability in your trading endeavors.
Key Features of Heikin-Ashi:
- Reduces market noise through averaging.
- Enhances trend visibility for better decision-making.
- Helps identify potential reversals effectively.
| Feature | Description |
|---|---|
| Smoothing Mechanism | Averaging method to minimize price fluctuations. |
| Trend Clarity | Clearly shows trends through consistent candlestick colors. |
| Market Sentiment | Interpretation of buying and selling pressure for trend analysis. |
The Mathematical Core: Demystifying Heikin-Ashi Calculations
To truly appreciate the power of Heikin-Ashi, we must delve into its underlying mathematical architecture. Unlike standard candlesticks which plot the exact Open, High, Low, and Close (OHLC) of a given period, Heikin-Ashi candles are constructed using a unique set of formulas that average price data, both from the current period and the previous Heikin-Ashi candle. This averaging function is precisely what gives Heikin-Ashi its remarkable smoothing properties, effectively filtering out ephemeral fluctuations and highlighting sustained movements.
Let’s break down the calculations for each component of a Heikin-Ashi candle:
- HA-Close: This is the average price of the current bar, calculated as:
(Current Open + Current High + Current Low + Current Close) / 4
This simple average of the current period’s real OHLC values provides a representative midpoint for the candle, acting as a crucial building block for the subsequent calculations. It’s a fundamental step in normalizing the price data. - HA-Open: The opening price of the current Heikin-Ashi candle is derived from the midpoint of the *previous* Heikin-Ashi candle, specifically:
(Previous HA-Open + Previous HA-Close) / 2
This formula is pivotal. By tying the current HA-Open to the previous HA-candle’s midpoint, it creates a continuous flow, preventing large gaps and contributing significantly to the smooth appearance of the Heikin-Ashi chart. It ensures that the ‘story’ of the trend unfolds organically, without jarring discontinuities. - HA-High: The highest point of the Heikin-Ashi candle is the maximum of three values:
Maximum of (Current High, Current HA-Open, Current HA-Close)
This ensures that the wick of the Heikin-Ashi candle accurately reflects the true highest price reached during the period, while also considering the influence of the smoothed HA-Open and HA-Close values. It’s about capturing the real price extreme while maintaining the Heikin-Ashi’s internal consistency. - HA-Low: Conversely, the lowest point of the Heikin-Ashi candle is the minimum of three values:
Minimum of (Current Low, Current HA-Open, Current HA-Close)
Similar to the HA-High, this calculation guarantees that the lower wick reflects the true lowest price, while also being influenced by the smoothed HA-Open and HA-Close. This careful consideration of real price extremes, alongside the smoothed averages, is what makes Heikin-Ashi so potent.
By understanding these formulas, you can grasp why Heikin-Ashi candles behave differently. They are not merely reflections of raw price; they are a calculated, smoothed representation designed to reduce market noise and make the underlying trend unmistakably clear. This distinct computational method leads directly to the visual characteristics that empower us as traders.
| Component | Calculation |
|---|---|
| HA-Close | (Current Open + Current High + Current Low + Current Close) / 4 |
| HA-Open | (Previous HA-Open + Previous HA-Close) / 2 |
| HA-High | Maximum of (Current High, Current HA-Open, Current HA-Close) |
| HA-Low | Minimum of (Current Low, Current HA-Open, Current HA-Close) |
Visualizing the Edge: How Heikin-Ashi Transforms Your Chart View
The true genius of Heikin-Ashi lies in its visual manifestation. Once the underlying mathematical transformations are complete, the resulting chart presents a dramatically different picture compared to traditional candlestick charts. This visual distinction is not just aesthetic; it’s profoundly functional, directly aiding in trend identification and filtering out distracting short-term price fluctuations.
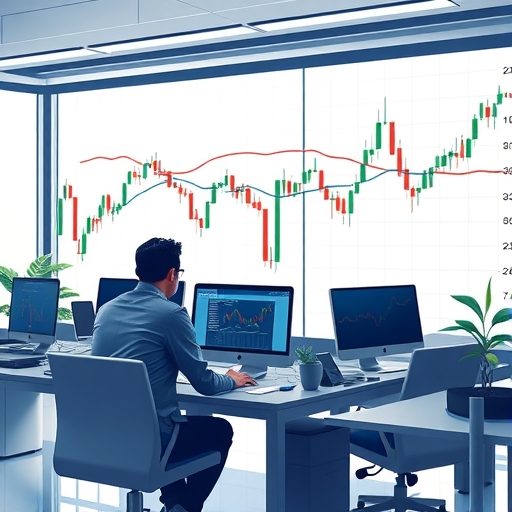
Consider a standard candlestick chart. You’ll often see a rapid alternation between green (or white) and red (or black) candles, even within a strong trend. Small counter-trend movements, brief periods of indecision, or minor pullbacks can generate opposing colored candles, creating a “noisy” appearance. This can lead to premature exits from profitable positions or cause hesitation in entering a developing trend. For a new trader, this visual cacophony can be overwhelming, making it difficult to discern the forest from the trees.
Heikin-Ashi charts, however, exhibit a far smoother appearance. Due to the averaging mechanism, candles tend to stay the same color during sustained trends. During a strong uptrend, you will see a series of consecutive hollow (or green) candles. Similarly, a robust downtrend will be characterized by a continuous sequence of filled (or red) candles. This consistent color stream dramatically simplifies trend identification. When you look at a Heikin-Ashi chart, the direction of the prevailing trend often jumps out at you, rather than requiring meticulous analysis of individual candle patterns.
Think of it like this: if traditional candlesticks show you every bump and pothole on a road, Heikin-Ashi provides a high-level view from an airplane, revealing the overall direction of the highway without getting bogged down in minor imperfections. This allows you to focus on the broader market momentum, reducing the emotional stress often associated with trying to react to every minor price swing. This inherent smoothing is a tremendous advantage for trend-following and swing traders, as it helps them remain in profitable positions for longer durations, avoiding the common pitfall of being shaken out by transient market noise.
Decoding the Signals: Mastering Heikin-Ashi for Trend Identification
Beyond its smoothing effect, Heikin-Ashi provides specific, actionable signals that are remarkably effective for identifying trend strength, potential reversals, and periods of market indecision. Learning to interpret these distinct candle formations is crucial for leveraging Heikin-Ashi to its full potential.
- Strong Uptrend: Look for a series of hollow (or green) candles with no lower “shadows” (wicks). This signifies that the buying pressure is overwhelmingly strong, and the market is consistently closing near its highs for each period. The absence of a lower wick indicates that the price rarely dipped below its Heikin-Ashi open, confirming aggressive upward momentum. When you see this pattern, it’s a powerful sign to stay in your long positions or look for opportunities to initiate new ones.
- Uptrend: A general uptrend is indicated by a sequence of hollow (or green) candles. While they may have small lower wicks, the predominant color and upward progression confirm that buyers are in control. This suggests a healthy, sustained move upward, even if not as aggressively as a “strong uptrend.”
- Trend Change or Indecision: This is a critical signal for potential reversals. Observe small-bodied candles surrounded by both upper and lower shadows (wicks). These candles, often resembling a traditional “Doji” or spinning top, indicate market equilibrium where neither buyers nor sellers are in decisive control. It suggests that the existing trend is losing momentum and a shift in direction may be imminent. This is your cue to tighten stop losses, consider taking partial profits, or prepare for a potential reversal trade.
- Downtrend: A sustained downtrend is signaled by a series of filled (or red) candles. These candles indicate that sellers are dominating the market, pushing prices lower. You might see small upper wicks, but the overall bearish color and downward progression confirm the prevailing selling pressure.
- Strong Downtrend: The most potent bearish signal is a sequence of filled (or red) candles with no higher shadows (wicks). This is the mirror image of a strong uptrend and signifies overwhelming selling pressure. The absence of an upper wick indicates that the price consistently closed near its lows for each period, confirming aggressive downward momentum. This pattern screams “bear market” or strong sell-off, prompting you to maintain or initiate short positions.
By focusing on these five distinct signals, you can quickly ascertain the market’s prevailing sentiment and momentum, making your trend identification process much more efficient and less prone to misinterpretation.
| Signal Type | Description |
|---|---|
| Strong Uptrend | Hollow candles with no lower wicks, indicating strong buying pressure. |
| Indecision | Small-bodied candles with shadows, suggesting market equilibrium. |
| Strong Downtrend | Filled candles with no upper wicks, indicating strong selling pressure. |
The Crucial Caveat: Understanding Heikin-Ashi’s Real-Time Price Limitation
While Heikin-Ashi offers profound advantages in trend identification and noise reduction, it’s paramount to understand its inherent limitation: it does not reflect the actual, real-time market prices of an asset. This is a critical distinction that new traders, especially, must internalize to avoid potential missteps.
Because Heikin-Ashi candles are calculated using averaged prices from both the current and previous periods, the opening, high, low, and closing values displayed on a Heikin-Ashi chart are synthetic, not the exact prices at which trades occurred. This means that if you’re looking at a Heikin-Ashi chart, the price you see for the current candle might not be the exact price at which you can execute a market order or set a precise limit order.
What are the implications of this? Primarily, it can lead to a slight delay in signals. While Heikin-Ashi excels at showing you the sustained trend, it might not give you the immediate, granular detail needed for precise entry and exit points. For instance, if you’re waiting for a specific support level to be tested before buying, relying solely on the smoothed Heikin-Ashi candle might cause you to miss the exact touch of that level, as the HA-Low might not precisely match the real market low.
Therefore, we cannot overstate the importance of complementing Heikin-Ashi with other technical analysis tools that provide real-time price context. Relying solely on Heikin-Ashi for trade execution is akin to navigating a complex city using only a map that shows major highways, without any street-level detail. You’ll know the general direction, but not the exact turn to take.
This limitation is not a flaw; it’s a characteristic. Heikin-Ashi’s strength is its trend-smoothing. Its “weakness” (in terms of precision) is an unavoidable consequence of that strength. Understanding this empowers you to use it intelligently, integrating it into a broader analytical framework rather than treating it as a standalone oracle for all trading decisions. For traders focused on scalping or very short-term entries and exits, the slight delay in real-time price representation might be a significant factor to consider. However, for swing traders and trend followers, this limitation is often negligible when weighed against the benefits of clear trend visibility.
Synergistic Power: Pairing Heikin-Ashi with Complementary Indicators
Given Heikin-Ashi’s strength in trend identification and its limitation regarding real-time price, its optimal use in the trading arena involves a strategic pairing with other technical indicators. This confluence of tools provides a more holistic market view, allowing for confirmation of trends, precise timing for entries and exits, and a deeper understanding of market momentum. Think of it as assembling a robust trading team, where each member brings a unique and valuable skill set.
- Moving Averages (MAs): Moving Averages are perhaps the most common and effective companions for Heikin-Ashi. When the Heikin-Ashi candles are consistently above a rising short-term (e.g., 9-period EMA) and long-term (e.g., 50-period SMA) Moving Average, it strongly confirms an uptrend. Conversely, candles consistently below falling MAs indicate a downtrend. A Heikin-Ashi color change while prices are interacting with a Moving Average can signal a potential breakout or breakdown. For example, if Heikin-Ashi turns green and crosses above a 20-period Exponential Moving Average (EMA), it could signal a strong buy opportunity, particularly if the MA itself is trending upwards.
- Bollinger Bands: These volatility bands provide a dynamic channel around a simple moving average, offering insights into overbought or oversold conditions and potential reversals. When Heikin-Ashi candles consistently hug the upper Bollinger Band with no lower wicks, it confirms a strong uptrend. A break of Heikin-Ashi candles below the middle band (20-period SMA) after a period of staying above it, especially with a color change to red, can be a potent sell signal. We can use the bands to assess if the trend is pushing prices to extreme levels, which can hint at exhaustion, even if the Heikin-Ashi candle color remains consistent.
- Relative Strength Index (RSI): The RSI is a momentum oscillator that measures the speed and change of price movements. While Heikin-Ashi shows trend direction, RSI can tell us about the underlying momentum strength and potential divergences. If Heikin-Ashi is showing a strong uptrend (green candles), but the RSI is showing bearish divergence (lower highs on RSI while price makes higher highs), it can be an early warning of an impending trend reversal or exhaustion, even before Heikin-Ashi itself changes color or displays indecision candles. We can use RSI to confirm the strength of the Heikin-Ashi trend, looking for RSI above 50 for uptrends and below 50 for downtrends.
- Volume: Though not an indicator on its own, volume is a crucial confirmation tool. A strong Heikin-Ashi trend (consistent colored candles) accompanied by increasing volume adds significant conviction to the move. Conversely, a Heikin-Ashi trend showing signs of indecision (small bodies, long wicks) on declining volume can signal a weakening trend before a reversal.
The beauty of combining these tools is that they compensate for each other’s limitations. Heikin-Ashi provides the clean trend, while MAs give dynamic support/resistance, Bollinger Bands offer volatility context, and RSI gauges momentum. This multi-layered approach to technical analysis significantly enhances the robustness of your trading signals, helping you make more informed and confident trading decisions. This is where the depth of your analysis truly comes into play, moving beyond a single indicator to a symphony of market data. For instance, imagine a scenario where Heikin-Ashi paints a vivid green picture of an uptrend, reinforced by the price trading above its 50-day moving average and the RSI holding comfortably above 60. This confluence of signals offers a high-probability setup for a trend-following trade. Conversely, if Heikin-Ashi shows initial signs of indecision, coupled with a bearish divergence on the RSI and price struggling at a key moving average, it’s a strong signal to either avoid entering or consider exiting a position.
If you’re looking to expand your trading horizons and apply these combined strategies to a diverse range of assets, including forex, cryptocurrencies, and various CFDs, then Moneta Markets is a platform worth exploring. Originating from Australia, it offers over 1000 financial instruments, providing ample opportunities for both novice and experienced traders to implement complex strategies with Heikin-Ashi and complementary indicators.
Executing Trades with Precision: Heikin-Ashi Entry and Exit Strategies
With a solid understanding of Heikin-Ashi’s signals and its synergistic pairing with other indicators, we can now discuss practical trading strategies for entry and exit points. The goal is to leverage Heikin-Ashi’s clarity to stay in profitable trends longer and identify optimal moments for action.
1. Trend-Following Entry Strategy:
For uptrends:
- Wait for a confirmed strong uptrend: a series of hollow/green Heikin-Ashi candles with little or no lower wicks.
- Look for a minor pullback or consolidation within the trend. This is often represented by a few small-bodied green candles with slightly larger lower wicks, or even one or two red Heikin-Ashi candles that do not break significant support (e.g., a rising Moving Average).
- Enter a long position when the Heikin-Ashi candle turns back into a strong green candle with no lower wick, confirming the resumption of the uptrend. This provides an optimal entry point at a more favorable price within the existing trend.
- Confirmation: Ensure your entry is confirmed by other indicators. For instance, if RSI remains above 50 (or bounces off it), and price bounces off a key moving average (like the 20-period EMA), this adds significant weight to your entry signal.
For downtrends (reverse logic):
- Wait for a confirmed strong downtrend: a series of filled/red Heikin-Ashi candles with little or no upper wicks.
- Look for a minor retracement or bounce, perhaps a small-bodied red candle with a slightly larger upper wick, or even one or two green Heikin-Ashi candles that do not break significant resistance.
- Enter a short position when the Heikin-Ashi candle turns back into a strong red candle with no upper wick, confirming the resumption of the downtrend.
- Confirmation: Confirm with RSI below 50 (or rejecting it from below) and price rejecting a falling moving average.
2. Exit Strategy:
Heikin-Ashi shines in helping you ride trends longer, but knowing when to exit is equally critical.
- Initial Warning: Look for the appearance of small-bodied Heikin-Ashi candles with both upper and lower wicks during an existing trend. This signals indecision and suggests the trend may be losing momentum. This is your first warning to be vigilant. Consider tightening your stop-loss or taking partial profits.
- Confirmation of Reversal: The definitive exit signal is when the Heikin-Ashi candles change color against the trend (e.g., green to red in an uptrend, or red to green in a downtrend). This confirms a shift in momentum and a potential trend reversal. This is often your cue to exit the remainder of your position.
- Combined with Support/Resistance: If Heikin-Ashi candles change color at a strong resistance level (for a long trade) or a strong support level (for a short trade), the signal is even more powerful.
For instance, imagine you are in a long position on SPDR S&P 500 ETF Trust (SPY), riding a strong uptrend confirmed by green Heikin-Ashi candles and a rising 50-period moving average. You start to see a few small-bodied green candles with long upper wicks, followed by the first red Heikin-Ashi candle. This pattern, especially if it occurs near a previous resistance level, would be a strong signal to exit your position. This disciplined approach prevents giving back significant profits during a reversal.
Implementing these strategies requires patience and discipline. The smoothed nature of Heikin-Ashi encourages waiting for clear signals rather than reacting to every minor fluctuation, which aligns perfectly with a calmer, more systematic approach to trading.
Advanced Tactics: Enhancing Profitability with Heikin-Ashi and Risk Management
Beyond basic entry and exit, sophisticated traders integrate Heikin-Ashi into more advanced strategies that prioritize maximizing gains while rigorously managing risk. This involves dynamic profit-taking, adaptive stop-loss adjustments, and even exploring hybrid chart overlays for richer insights. Mastering these tactics is crucial for transitioning from a novice to a consistently profitable trader.
Dynamic Profit-Taking and Stop-Loss Management:
Instead of a single, fixed profit target, consider a phased approach:
- Partial Profit-Taking: As your Heikin-Ashi-identified trend progresses, and you see signs of minor indecision (e.g., smaller candle bodies, longer wicks, but still the trend color), consider taking a portion of your profits off the table (e.g., 25-50% of your position). This secures gains while allowing you to participate in further trend continuation.
- Trailing Stop-Loss: Adjust your stop-loss dynamically as the trend evolves. A common strategy is to place your stop-loss below the low of the previous Heikin-Ashi candle in an uptrend, or above the high of the previous Heikin-Ashi candle in a downtrend. As new, favorable candles print, move your stop-loss accordingly. This ensures that if the trend reverses, you are stopped out with a profit, or at least a minimal loss, rather than giving back all your gains. For example, if trading NVIDIA (NVDA) on a strong uptrend with Heikin-Ashi, you could move your stop loss below the low of the most recent green candle. If the next candle is also green and higher, you move your stop loss up again, effectively trailing the price action.
- Heikin-Ashi Color Change as Final Exit: When the Heikin-Ashi candle definitively changes color (e.g., from green to red in an uptrend), it’s often the signal to exit the remainder of your position. This indicates that the sustained momentum has likely broken, and a more significant reversal may be underway.
Heikin-Ashi as Dynamic Support and Resistance:
In a strong trend, the Heikin-Ashi open of a candle can often act as dynamic support (in an uptrend) or resistance (in a downtrend). Traders can watch for prices to pull back to these levels and then resume the trend with a fresh Heikin-Ashi candle of the trend’s color, offering re-entry opportunities. This is particularly effective when combined with Moving Averages.
Exploring Hybrid Heikin-Ashi Applications:
Some advanced charting platforms allow you to overlay Heikin-Ashi on top of traditional candlesticks, or display both side-by-side. This novel approach aims to reconcile the benefits of smoothed trend visibility with the immediate, real-time price action. You get the clarity of Heikin-Ashi for trend confirmation, while still being able to see the exact opening, high, low, and closing prices of the regular candles for precise order placement and detailed pattern recognition (e.g., spotting a Hammer or Doji on the actual price chart). This can significantly reduce false signals by providing two layers of confirmation.
A recent innovation in some trading communities has been the development of proprietary indicators that attempt to combine the best of both worlds, aiming for superior profitability and even further reduced false signals compared to using Heikin-Ashi in isolation. While the specifics of such “new indicators” vary, their underlying principle often involves using Heikin-Ashi as a primary filter for trend direction and then overlaying specific entry/exit triggers derived from real-time price action or other momentum indicators.
Remember, no single indicator guarantees success. The true skill lies in synthesizing information from multiple sources and applying disciplined risk management. Trading success is not just about identifying opportunities, but also about preserving capital and managing drawdowns. This integrated approach, where Heikin-Ashi provides the directional clarity and other tools offer precision and confirmation, forms a powerful framework for consistent profitability.
Heikin-Ashi in Action: Practical Applications Across Asset Classes
Heikin-Ashi’s adaptability makes it a valuable tool across a wide spectrum of financial instruments, from equities and commodities to cryptocurrencies and foreign exchange. Its ability to clearly display trends, regardless of the underlying asset’s volatility, makes it a universal aid for traders aiming to capitalize on momentum.
Equities and ETFs:
Consider applying Heikin-Ashi to highly liquid stocks like Apple (AAPL) or popular ETFs such as the SPDR S&P 500 ETF Trust (SPY). During a strong bull market, you would typically observe extended periods of green Heikin-Ashi candles with minimal lower wicks on daily or weekly charts, encouraging you to stay in long positions. Conversely, a stock sell-off would manifest as continuous red Heikin-Ashi candles without upper wicks. Heikin-Ashi helps cut through the noise of daily fluctuations, preventing premature exits during minor pullbacks. For instance, if SPY is in a clear uptrend, seeing a single red traditional candlestick might prompt a panic sell, but the Heikin-Ashi chart might still show a green candle with a small body, indicating a mere pause rather than a reversal, helping you maintain your conviction.
Cryptocurrencies:
The cryptocurrency market, known for its extreme volatility, can be particularly challenging for trend identification using traditional charts. Assets like Bitcoin (BTC/USD) and Ethereum (ETH/USD) often exhibit rapid, large swings that can generate numerous misleading signals. Heikin-Ashi’s smoothing mechanism is incredibly beneficial here. It can filter out the extreme whipsaws, allowing you to see the true underlying bullish or bearish momentum. For example, during a strong crypto bull run, Heikin-Ashi would present a clear series of green candles, allowing you to ride the wave without being rattled by sharp, but ultimately transient, pullbacks. Conversely, in a bearish channel, red Heikin-Ashi candles would dominate, helping you avoid trying to catch falling knives. This clarity is invaluable when navigating the often-turbulent waters of digital assets.
Forex (Foreign Exchange):
In the fast-paced forex market, currency pairs like GBP/JPY or EUR/USD often move in prolonged trends, making Heikin-Ashi an ideal tool for trend-following strategies. The consistent color of Heikin-Ashi candles helps identify whether a currency pair is in a clear uptrend or downtrend, aiding in determining the overall direction for trades. For instance, if GBP/JPY is exhibiting a strong series of red Heikin-Ashi candles on the 4-hour chart, it signals a strong downtrend, prompting you to look for shorting opportunities on smaller timeframes or stay in existing short positions. The smoothed view helps you overlook the small, choppy movements that often occur during intra-day trading, allowing you to focus on the more significant, profitable swings. Identifying whether a currency pair is consolidating or trending becomes significantly easier with Heikin-Ashi, which is crucial for distinguishing between range-bound strategies and trend-following approaches.
When considering platforms for engaging in the dynamic world of forex trading and exploring various CFD instruments, Moneta Markets stands out. It’s a well-regulated broker with licenses from authorities like FSCA, ASIC, and FSA, providing robust oversight for your trading activities. They offer comprehensive support, including 24/7 Chinese customer service and free VPS, which are essential for traders utilizing sophisticated technical analysis tools like Heikin-Ashi across different timeframes and asset classes.
Commodities and Futures:
Commodities like Crude Oil or Gold, and their respective futures contracts, also display clear trends where Heikin-Ashi can be effectively applied. From identifying a strong agricultural commodity bull run to recognizing a prolonged bearish trend in energy prices, Heikin-Ashi provides the visual simplicity needed to stay aligned with the broader market direction. Whether you are trading on daily, weekly, or even monthly charts, Heikin-Ashi consistently offers a less noisy perspective, making it easier to assess the market’s long-term trajectory. However, it’s crucial to remember that futures and options trading involve substantial risk, and speculative activities can result in significant losses. Always ensure you understand the risks involved and comply with regulatory guidelines, such as CFTC Rule 4.41 which requires a disclaimer for hypothetical performance.
Across all these asset classes, Heikin-Ashi’s consistent benefit is its ability to highlight the dominant market flow. It helps traders avoid getting caught up in the “noise” and instead align their strategies with the most powerful forces at play, whether those are sustained buying pressure in a tech stock or overwhelming selling pressure in a currency pair. This universality makes it an indispensable tool in any serious trader’s arsenal.
Your Journey Forward: Integrating Heikin-Ashi into Your Trading Blueprint
We’ve journeyed through the intricacies of Heikin-Ashi, from its unique mathematical foundation to its practical application in diverse markets. We’ve seen how this powerful technical analysis tool, meaning “average bar” in Japanese, fundamentally transforms your chart view by smoothing out market noise and revealing clear, sustained trends. We’ve explored its distinct signals for identifying strong uptrends, downtrends, and crucial periods of market indecision, equipping you with the visual cues needed to make more informed trading decisions.
However, as we’ve emphasized, Heikin-Ashi is not a silver bullet. Its reliance on averaged prices means it does not present real-time prices, underscoring the critical importance of its synergy with other technical analysis tools. When combined with indicators like Moving Averages, Bollinger Bands, and the Relative Strength Index, Heikin-Ashi’s clarity is amplified, leading to more robust trade confirmations and precise entry/exit points. We have also discussed advanced strategies, such as dynamic profit-taking and adaptive stop-loss management, which empower you to maximize gains and diligently manage risk, transforming theoretical knowledge into practical profitability.
Integrating Heikin-Ashi into your personal trading blueprint means embracing a more disciplined, trend-following approach. It encourages patience, reducing the temptation to react to every minor price fluctuation. By focusing on the smooth flow of Heikin-Ashi candles, you can stay in profitable positions longer, avoid premature exits, and minimize the emotional impact of market volatility. Remember, the journey to becoming a consistently profitable trader is one of continuous learning, adaptation, and unwavering discipline. The “Sage Archetype” within us, driven by a mission to simplify complex financial knowledge, is here to guide you. By mastering tools like Heikin-Ashi and applying them within a comprehensive understanding of market context and rigorous risk management, you are well on your way to confidently engaging with substantial market trends and elevating your overall trading profitability.
Whether you are honing your skills in forex, exploring options on the NASDAQ Composite, or delving into the intricacies of commodities, the principles of Heikin-Ashi remain steadfast. Embrace its insights, experiment with its combinations, and let it illuminate the path to smarter, more successful trading.
heiken ashiFAQ
Q:What is Heikin-Ashi?
A:Heikin-Ashi is a charting technique that averages price data to create smoother candlesticks, aiding in trend identification.
Q:How can I use Heikin-Ashi in my trading?
A:Heikin-Ashi can be used to identify trends, potential reversals, and market indecision, enhancing decision-making processes.
Q:What are the limitations of Heikin-Ashi?
A:Heikin-Ashi does not reflect real-time market prices, as it uses averaged values, which may lead to signal delays.