
Introduction: What is Volatility in Forex and Why It Matters?
In the world of foreign exchange, volatility isn’t just a statistical term—it’s the pulse of the market. At its core, volatility measures how quickly and significantly the price of a currency pair shifts over time. It reflects the extent to which a currency’s value strays from its average, capturing the speed and intensity of those movements. For traders, grasping this concept goes far beyond theory; it’s foundational to shaping strategies, managing risk, and spotting opportunities that others might miss. When volatility spikes, prices can swing dramatically in minutes, opening doors to outsized gains—but also exposing traders to steep losses. On the flip side, low volatility brings calmer conditions, where prices drift within narrow bands and momentum stalls. This guide dives deep into the dynamics of forex volatility, unpacking its origins, how to track it, and the strategic shifts needed to navigate turbulent or stagnant markets. Whether you’re a novice or seasoned trader, understanding volatility is key to making sharper, more confident decisions.
The Core Mechanics: How Volatility Manifests in Currency Markets
Volatility isn’t random noise—it’s the visible rhythm of market sentiment, liquidity shifts, and global events playing out in real time. It shapes how prices move, how trends develop, and how traders interpret signals. Recognizing its patterns allows for better anticipation of breakouts, reversals, and periods of stagnation.
Defining Price Swings: Pips, Ranges, and Market Movements
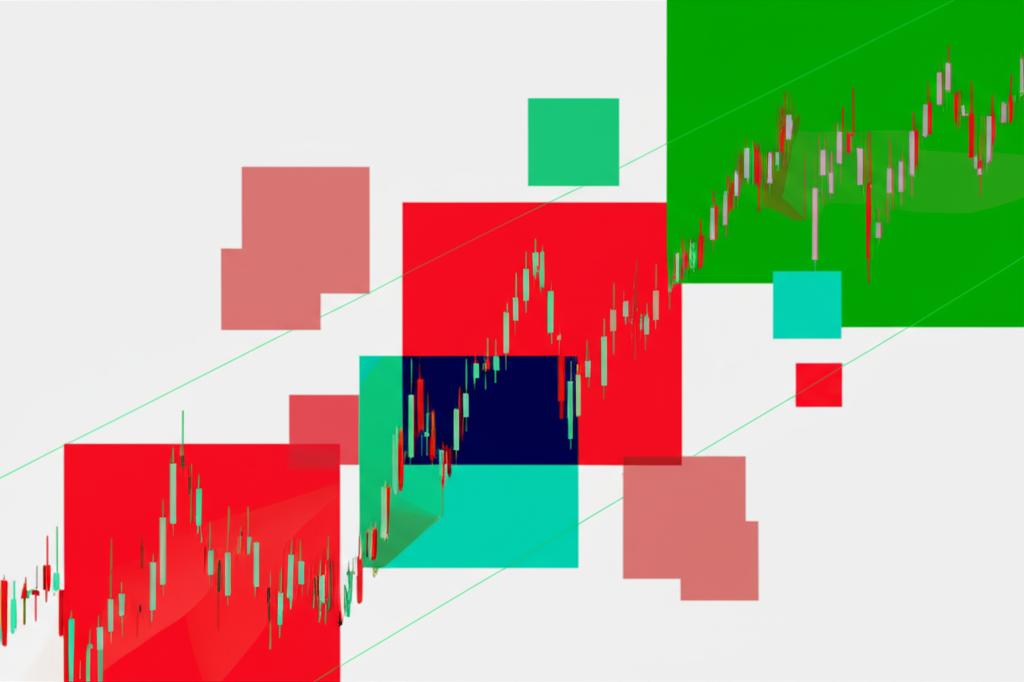
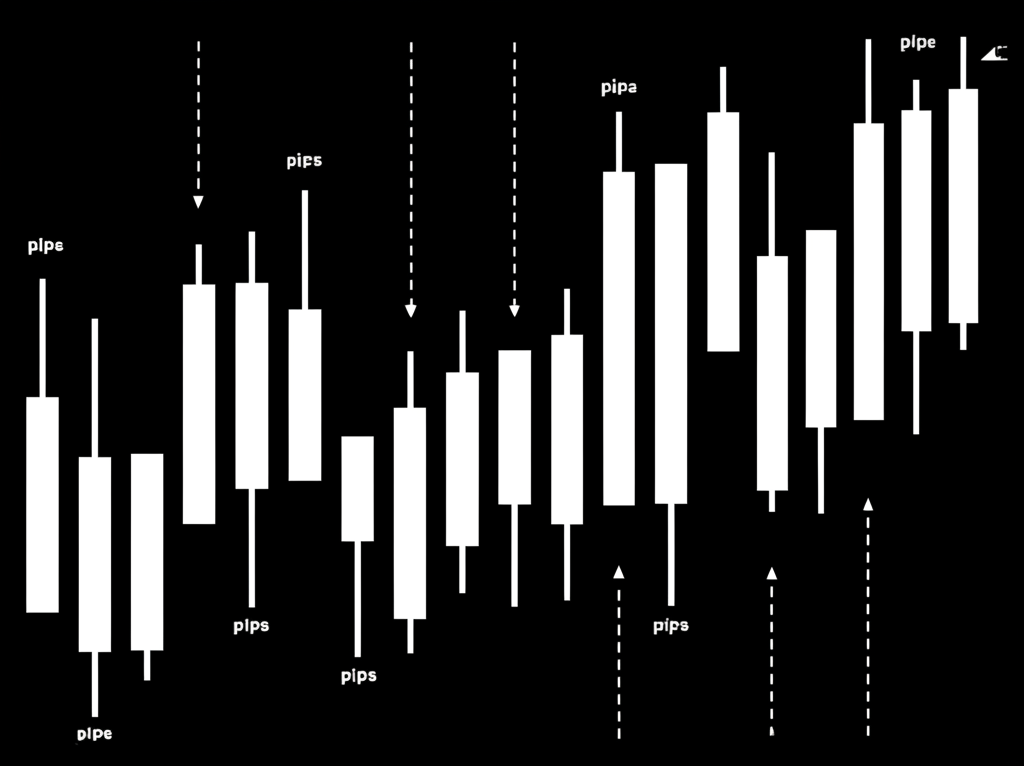
The most immediate sign of volatility lies in the size and speed of price movements. In forex, these shifts are measured in pips—the smallest incremental change in a currency pair’s quote. A pair that jumps 120 pips in a few hours is clearly more volatile than one inching forward by 20 pips over the same period. Daily trading ranges, the distance between high and low points, also reveal volatility trends. Wide ranges suggest aggressive buying and selling, often driven by strong sentiment or news. The pace matters too: sharp, jagged candlesticks on a chart point to heightened uncertainty and rapid position adjustments, while small, tight candles reflect indecision and consolidation. These visual cues help traders distinguish between markets ripe for breakout strategies and those better suited for cautious, range-based approaches.
Key Drivers of Forex Volatility: What Makes Prices Fluctuate?
Behind every price swing is a catalyst. The forex market doesn’t move in isolation—it reacts to powerful forces that ripple across economies and continents.
* **Economic Data Releases:** Reports like the U.S. Non-Farm Payrolls (NFP), Consumer Price Index (CPI), and Gross Domestic Product (GDP) act as market triggers. When actual figures deviate from forecasts, traders quickly reassess a currency’s strength. A hotter-than-expected inflation reading might spark bets on rate hikes, sending a currency soaring. Conversely, weak employment data can trigger a sell-off. The bigger the surprise, the more violent the reaction—sometimes hundreds of pips in minutes.
* **Central Bank Policy Shifts:** Institutions like the Federal Reserve, European Central Bank, and Bank of Japan directly influence currency values through interest rate decisions, quantitative easing, and forward guidance. A surprise rate cut can undermine a currency’s appeal, while hawkish commentary can fuel rallies. Even subtle shifts in tone during press conferences can ignite volatility.
* **Geopolitical Uncertainty:** Wars, elections, trade disputes, and diplomatic tensions inject unpredictability. Markets hate uncertainty, and when major events unfold—such as a contested election or military escalation—traders often flee to safe-haven currencies like the Japanese yen (JPY) or Swiss franc (CHF). This flight to safety can cause sharp, sustained moves in multiple pairs. The Council on Foreign Relations tracks many such geopolitical flashpoints that could spark currency market disruptions.
* **Market Sentiment and Risk Appetite:** Broader investor psychology plays a major role. In risk-on environments, traders favor growth-linked currencies like the Australian dollar (AUD) or New Zealand dollar (NZD). When fear takes hold, they unwind these positions and shift into safer assets, amplifying volatility in commodity-linked and emerging market currencies. Stock market swings, bond yields, and commodity price moves all feed into this sentiment cycle.
Measuring Volatility: Essential Tools and Indicators for Traders
To trade effectively, volatility must be quantified. Raw price action tells part of the story, but technical tools provide clarity, helping traders assess current conditions and anticipate shifts.
Average True Range (ATR): Gauging the Market’s “Average” Movement
The Average True Range (ATR) is a go-to indicator for measuring volatility without predicting direction. It calculates the average price range over a set number of periods—typically 14—factoring in gaps and limit moves. The true range is the greatest of three values: the current high minus low, the absolute difference between the high and previous close, or the low and previous close.
A rising ATR signals growing volatility, meaning larger average price swings. A falling ATR points to stability and tighter ranges. Traders use ATR to:
* **Set Dynamic Stop-Loss Levels:** Instead of fixed distances, many place stops at a multiple of the ATR (e.g., 1.5x or 2x) to account for current market noise.
* **Confirm Trend Strength:** If price is trending upward and ATR is expanding, the move has conviction. Falling ATR during a trend may signal exhaustion.
* **Adjust Profit Targets:** In high-ATR environments, larger targets may be justified. In low-ATR markets, smaller gains are more realistic.
Bollinger Bands: Visualizing Price Deviation and Potential Reversals
Bollinger Bands offer a visual way to track volatility and potential turning points. They consist of a middle line (usually a 20-period simple moving average) and two outer bands set two standard deviations above and below. As volatility increases, the bands widen; during calm periods, they contract.
Traders use Bollinger Bands to:
* **Assess Volatility:** Wide bands mean high volatility; narrow bands signal low volatility.
* **Spot Overextended Prices:** When price touches or breaches the upper band, it may be overbought; touching the lower band can suggest oversold conditions—though in strong trends, price can ride the bands.
* **Predict Breakouts:** A “squeeze,” where bands tighten significantly, often precedes explosive moves. Traders watch for a decisive breakout above or below the bands as a potential entry signal.
Historical vs. Implied Volatility: A Deeper Dive into Future Expectations
While ATR and Bollinger Bands reflect past and present volatility, understanding future expectations requires a different lens.
* **Historical Volatility (HV):** This backward-looking metric calculates actual price fluctuations over a defined period, usually using standard deviation of returns. HV helps traders understand a pair’s typical behavior—how much it usually moves in a day or week. It’s useful for backtesting strategies and setting baseline expectations, but it doesn’t forecast what’s ahead.
* **Implied Volatility (IV):** Derived from options pricing, IV reflects the market’s consensus on how volatile a currency pair is expected to be in the future. High IV means traders anticipate big moves—often ahead of major news or events. Low IV suggests calm is expected. Traders use IV to:
* **Evaluate Risk:** High IV increases the chance of sharp swings, affecting position sizing.
* **Choose Strategies:** High IV favors selling options (premium collection), while rising IV benefits buyers.
* **Gauge Sentiment:** A sudden spike in IV often signals rising fear or anticipation.
While HV shows what occurred, IV reveals what the market collectively believes will happen—making it a powerful tool for proactive decision-making. The CBOE Volatility Index (VIX), though equity-focused, exemplifies how implied volatility can act as a “fear gauge” across financial markets.
The Impact of Volatility on Forex Trading Decisions
Volatility isn’t just a number—it shapes every trading choice, from entry points to risk exposure. Ignoring its influence can turn a sound strategy into a losing one.
High Volatility: Opportunities for Profit and Magnified Risk
High volatility brings excitement—and danger. Prices can surge or plunge in minutes, creating chances for rapid profits. Breakout and trend-following strategies thrive when momentum builds. For example, a strong NFP report might launch USD pairs on a sustained move, offering clear directional trades. But the same conditions can wipe out unprepared traders. Stop-loss orders may be hit by short-term noise, slippage can erode entries, and spreads often widen, increasing trading costs. Emotional discipline is critical—what looks like a breakout could reverse just as fast. Success here demands strict risk controls, including smaller position sizes and well-placed stops that account for normal market churn.
Low Volatility: The Challenges of Range-Bound and Choppy Markets
When volatility dries up, markets often settle into tight ranges. Price movement becomes sluggish, and trends lose steam. This environment frustrates traders looking for momentum but creates opportunities for others. Range-bound strategies—buying support, selling resistance—can work well. Mean reversion approaches, which bet on price returning to a moving average, also gain traction. However, false breakouts are common, leading to whipsaws that trigger stop-losses repeatedly. In such conditions, patience pays off. Traders might also turn to carry trades, profiting from interest rate differentials between currencies, especially when price swings are too small to generate meaningful gains otherwise.
Identifying Volatile Currency Pairs: Where to Find Action
Not all pairs move the same. Some are naturally more turbulent due to economic structure, liquidity, or sensitivity to external shocks.
* **Exotic Pairs:** Currencies like USD/ZAR (South African rand) or EUR/TRY (Turkish lira) are highly volatile. Thin order books mean small trades can cause outsized moves, and political or economic instability adds fuel.
* **Commodity Currencies:** The AUD, CAD, and NZD are tied to resource prices. Oil swings hit the CAD, iron ore moves the AUD, and global demand shifts affect all three.
* **Cross Pairs:** Pairs like GBP/JPY or EUR/JPY combine two active currencies, often amplifying volatility. The yen’s role in carry trades means sudden risk-off moves can trigger violent swings.
Understanding these tendencies helps traders align their style with the right instruments.
| Currency Pair | Typical Volatility Level | Primary Drivers |
| :———— | :———————– | :————– |
| GBP/JPY | High | Geopolitical events, interest rate differentials, market sentiment for both currencies |
| USD/ZAR | Very High | Commodity prices (gold, platinum), emerging market sentiment, South African economic data |
| AUD/JPY | High | Commodity prices (iron ore, coal), risk sentiment (carry trade unwinds) |
| EUR/GBP | Moderate to High | Brexit developments, relative economic performance of Eurozone and UK |
| USD/MXN | Very High | Oil prices, U.S. economic data, Mexican political/economic events |
Navigating Volatility: Advanced Strategies and Robust Risk Management
Mastering volatility isn’t about predicting every move—it’s about adapting and protecting capital no matter the market phase.
Adapting Trading Strategies to Different Volatility Regimes
Flexibility is a hallmark of successful traders. Strategies that work in one environment can fail in another.
* **High Volatility Strategies:**
* **Breakout Trading:** Enter when price clears key resistance or support, confirming with volume or momentum indicators.
* **News Trading:** Capitalize on immediate reactions to major data releases. Requires fast execution and tight risk rules.
* **Trend-Following:** Use moving averages or momentum oscillators to ride strong moves, adjusting stops to accommodate larger swings.
* **Low Volatility Strategies:**
* **Range Trading:** Identify support and resistance zones and trade bounces within the channel.
* **Mean Reversion:** Use RSI or Bollinger Bands to spot overextended prices and fade extremes.
* **Carry Trades:** Hold high-yielding currencies against low-yielding ones, collecting daily interest—ideal when exchange rate risk is minimal.
The Critical Role of Risk Management in Volatile Markets
No strategy survives long without solid risk controls, especially when markets turn erratic.
* **Position Sizing:** Limit risk to a fixed percentage of capital per trade—typically 1-2%. In high volatility, consider reducing this further.
* **Stop-Loss Discipline:** Always use stops. In turbulent markets, place them beyond recent swing points to avoid being shaken out by noise.
* **Diversification:** Spread exposure across uncorrelated pairs or asset classes to reduce dependency on a single trade.
* **Avoid Over-Leverage:** High leverage magnifies losses just as quickly as gains. In volatile conditions, even small moves can trigger margin calls.
* **Adjust Risk Per Trade:** If volatility doubles, halve your position size to keep dollar risk consistent.
The Liquidity-Volatility Nexus: Why Both Are Crucial
Liquidity and volatility are two sides of the same coin. Major pairs like EUR/USD or USD/JPY have deep liquidity—thousands of participants and tight spreads—resulting in smoother price action. Exotic pairs, with fewer buyers and sellers, suffer from low liquidity. Here, even modest orders can trigger large price jumps, making volatility more erratic and harder to manage. Low liquidity also brings wider spreads and slippage, increasing trading costs and execution risk. A volatile pair might look attractive, but if it’s illiquid, it’s often a minefield. The Bank for International Settlements (BIS) regularly analyzes these dynamics, highlighting how liquidity dries up during crises, amplifying volatility exactly when traders are most exposed.
Conclusion: Mastering Volatility for Consistent Forex Success
Volatility defines the forex landscape—its rhythms, risks, and rewards. It’s not an obstacle to overcome, but a force to understand and harness. From economic data to central bank signals and global tensions, multiple drivers shape how currencies move. Tools like ATR and Bollinger Bands bring clarity, while the distinction between historical and implied volatility offers both retrospective insight and forward-looking foresight. The real edge, however, comes from adaptability. Matching your strategy to the market’s current state—whether explosive or stagnant—and enforcing disciplined risk management are what separate consistent performers from the rest. Recognizing the link between liquidity and volatility adds another layer of protection. Ultimately, success in forex isn’t about avoiding volatility—it’s about navigating it with skill, precision, and resilience.
Frequently Asked Questions About Forex Volatility
What exactly does “high volatility” mean for a forex trader, and how does it differ from low volatility?
For a forex trader, “high volatility” means that the price of a currency pair is experiencing large and rapid fluctuations over a short period. This translates to bigger potential profits (and losses) per pip, faster market movement, and potentially wider trading ranges. Low volatility, in contrast, means the price is moving slowly and within a tight range, resulting in smaller pip movements, reduced profit potential from price action, and often choppier, less directional markets. High volatility demands more aggressive risk management and quick decision-making, while low volatility often requires patience or specific range-bound or carry trade strategies.
How do major economic announcements, such as NFP or CPI, specifically impact forex volatility?
Major economic announcements like the Non-Farm Payrolls (NFP) or Consumer Price Index (CPI) reports impact forex volatility primarily through market surprise and expectation. When the actual data significantly deviates from market consensus forecasts, it can trigger a rapid re-evaluation of a country’s economic outlook and future monetary policy. This leads to a surge in buying or selling pressure for the associated currency, causing sharp and immediate price swings (high volatility) as traders adjust positions to reflect the new information. The greater the surprise, the higher the volatility.
What are the most effective trading strategies to employ during periods of high market volatility?
During periods of high market volatility, effective strategies often include:
- Breakout Trading: Identifying key support/resistance levels and entering trades when price breaks forcefully through them.
- Trend-Following: Capitalizing on strong, sustained directional moves, often with wider stop-losses to accommodate larger swings.
- News Trading: Trading around high-impact economic releases, though this is high-risk and requires precise execution.
Always couple these with strict risk management, including appropriate position sizing and stop-loss placement.
Can the “5-3-1 rule” be effectively applied to identify and trade volatile forex conditions?
The “5-3-1 rule” is not a universally recognized or standard forex trading rule for identifying volatility. However, if referring to a risk management principle (e.g., risking 1% of capital per trade, with a 3% daily loss limit, and a 5% weekly loss limit), then yes, principles of strict risk management are absolutely critical in volatile conditions. While it doesn’t identify volatility, such a rule helps traders manage their exposure and protect capital when volatility is high. Traders should define their own risk parameters based on their capital and risk tolerance, especially in fast-moving markets.
Beyond just definition, what are the practical implications of the liquidity-volatility relationship for a trader?
The practical implications are significant:
- Execution Quality: In low-liquidity, high-volatility markets, you’re more likely to experience wider spreads and slippage, meaning your trades might be executed at a less favorable price than intended.
- Cost of Trading: Wider spreads directly increase transaction costs.
- Risk of Large Swings: Low liquidity means fewer participants, so even small orders can cause disproportionately large price movements, increasing risk.
- Pair Selection: Traders often prefer highly liquid major pairs (e.g., EUR/USD, GBP/USD) for their tighter spreads and more predictable volatility, avoiding exotic pairs where liquidity is thin.
Are there reliable methods or indicators for forecasting future volatility in specific currency pairs?
While no method can perfectly forecast future volatility, some tools provide strong indications:
- Implied Volatility (IV): Derived from options prices, IV is a forward-looking measure of expected future volatility.
- Economic Calendar: Monitoring upcoming high-impact economic data releases and central bank decisions can anticipate periods of increased volatility.
- Bollinger Bands Squeeze: A significant narrowing of Bollinger Bands often precedes a period of increased volatility.
- Geopolitical Analysis: Staying informed about major global political events can help anticipate market uncertainty.
Combining these methods offers a more robust outlook.
Which particular currency pairs consistently exhibit the highest levels of volatility, and what drives this?
Currency pairs that consistently exhibit higher volatility include:
- Exotic Pairs: (e.g., USD/ZAR, EUR/TRY) due to lower liquidity and specific economic/political sensitivities.
- Commodity Currencies against Majors: (e.g., AUD/JPY, USD/CAD) as their value is highly sensitive to commodity prices and risk sentiment.
- Cross Pairs involving GBP or JPY: (e.g., GBP/JPY, EUR/JPY) often due to the unique economic factors impacting the UK and Japan, and their use in carry trades.
These pairs are driven by a combination of lower liquidity, dependence on volatile commodity markets, and specific national economic or political events.
How should risk management be adapted and strengthened when trading in highly volatile forex environments?
In highly volatile forex environments, risk management must be strengthened by:
- Reducing Position Size: Risking a smaller percentage of your capital per trade to account for larger potential swings.
- Adjusting Stop-Losses: Potentially using wider stop-losses (relative to normal market conditions) to avoid being “stopped out” prematurely by market noise, but always ensuring your risk per trade remains acceptable.
- Avoiding Over-Leveraging: Excessive leverage in volatile markets can lead to rapid account depletion.
- Monitoring News Closely: Being aware of upcoming high-impact events that could trigger sudden spikes in volatility.
- Considering Time Horizon: Shorter-term trades are more susceptible to high volatility; consider if your strategy suits the current market pace.
What is the main difference in application between historical volatility and implied volatility for a forex trader?
The main difference lies in their temporal focus and application:
- Historical Volatility (HV): Measures past price fluctuations. Its application is retrospective, used for backtesting strategies, understanding a pair’s typical movement range, and calibrating stop-loss distances based on what has *already happened*.
- Implied Volatility (IV): Represents the market’s expectation of future volatility, derived from options prices. Its application is proactive, used for assessing future risk, selecting appropriate strategies (e.g., option selling in high IV, option buying in low IV), and gauging overall market sentiment regarding future price action.
HV tells you what was, IV tells you what the market expects will be.
Is it genuinely possible to generate profits from forex markets during extended periods of very low volatility?
Yes, it is possible, but it often requires different strategies than those used in volatile markets. During extended periods of low volatility, traders might employ:
- Range Trading: Buying at established support levels and selling at resistance levels within a defined price channel.
- Mean Reversion Strategies: Betting on prices returning to their average after small deviations.
- Carry Trades: Profiting from the interest rate differential between two currencies, which is more effective when price volatility is low enough not to negate interest gains.
Patience and precise execution are crucial, as profit potential from price movement alone is limited.