
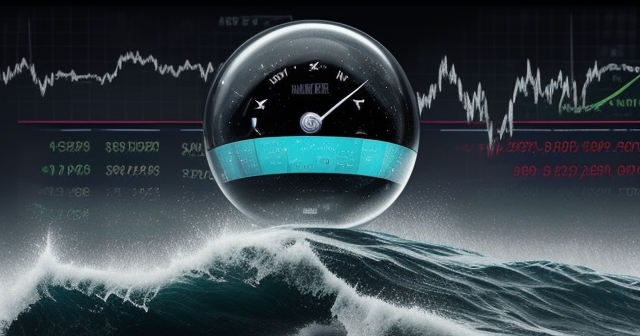
Navigating the complexities of financial markets can feel like charting a course through unpredictable waters. For decades, traders and investors have sought reliable tools and methodologies to identify potential turning points and anticipate significant price movements. Among the most respected names in the realm of technical analysis is Tom DeMark, a veteran strategist whose career spans over fifty years. DeMark is renowned for developing a proprietary system of DeMARK Indicators designed specifically for market timing. Unlike conventional approaches that often confirm existing trends, DeMARK’s methodology aims to anticipate changes in price direction before they become apparent to the broader market.
Today, DeMark’s analysis is drawing significant attention, particularly his recent warnings concerning the US stocks market. Despite periods of recent optimism and rallies, DeMark’s indicators are signaling an imminent peak and forecasting a potential bear market. This isn’t a casual observation; it’s a prediction rooted in a rigorous, mathematically based system developed over half a century of market observation and analysis. What makes this forecast particularly compelling is DeMark’s track record of accurately calling significant market turns in the past, including the S&P 500‘s peak in February and its low in April of the same year.
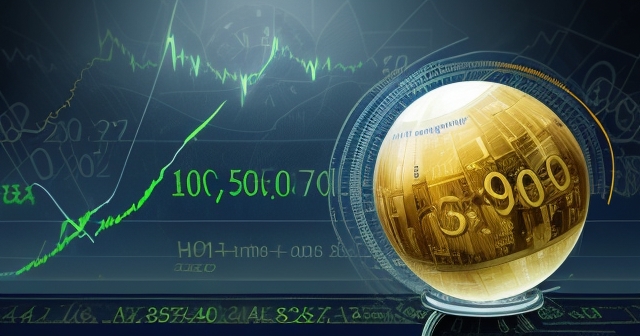
Let’s delve into the specifics of Tom DeMark’s current outlook. He forecasts a significant downturn for the S&P 500 index, suggesting it is poised for a substantial decline. According to his analysis, the index could fall below the 4835 level. Why is this number significant? Because a drop of more than 20% from its recent February peak would officially signal a formal bear market. This is not merely a minor correction but a shift in the overarching market trend, typically characterized by sustained declines and increased volatility.
- Trend Analysis: DeMark uses mathematical signals to identify potential market tops and bottoms.
- Risk Assessment: His indicators provide insights into market volatility and trend exhaustion.
- Market Timing: DeMARK Indicators focus on anticipating price reversals based on historical price action.
Understanding the potential magnitude of this move is crucial for investors. A 20%+ decline can erase substantial gains and challenge portfolio stability. DeMark’s warning serves as a critical piece of information for both new and experienced market participants, urging caution and a re-evaluation of existing positions. His prediction isn’t based on gut feeling or macro-economic speculation alone, but on the precise signals generated by his proprietary DeMARK Indicators. These indicators, developed through extensive research and mathematical modeling, are designed to provide objective entry and exit signals by identifying periods of trend exhaustion.
Is this forecast definitive? In financial markets, nothing is ever guaranteed. However, when a strategist with DeMark’s reputation and historical accuracy issues such a warning, it warrants serious attention. His ability to anticipate the February peak and April low lends significant weight to his current prediction. We should consider the methodology behind these calls to understand their potential reliability.
So, what exactly are DeMARK Indicators, and how do they work? At their core, DeMARK Indicators constitute a proprietary system built on specific mathematical relationships between successive price bars. Unlike many common technical indicators that rely on moving averages or oscillators to confirm a trend once it’s established, DeMARK Indicators are anticipatory tools. Their primary goal is to identify potential price inflection points – moments where a trend is likely to reverse or at least pause significantly – *before* the reversal is obvious to everyone.
Imagine a car running out of gas. Most indicators are like looking at the speedometer dropping or the car slowing down to confirm it’s running low. DeMARK Indicators, in contrast, are like having a precise fuel gauge that tells you, based on complex calculations of past fuel consumption and current speed, exactly how many more miles you can go before you run out. They measure the “exhaustion” of a trend by analyzing patterns of price action that suggest momentum is waning and supply/demand dynamics are shifting.
This focus on trend exhaustion is a defining characteristic of DeMARK’s work. His methods quantify the buying or selling pressure to identify when it’s reaching a climax. When a trend has pushed too far, too fast, for too long, DeMARK indicators can signal that it’s overextended and vulnerable to a reversal. This approach requires a deep understanding of market dynamics and a willingness to look for signals that counter prevailing sentiment, which is often strongest at market tops and bottoms.

One of the significant strengths of the DeMARK Indicators is their universal applicability. They are designed to work across virtually any asset class – US stocks, indices like the S&P 500, commodities, bonds, and currencies (forex). Furthermore, they can be applied to various timeframes, from intraday charts to weekly or monthly perspectives. This makes them a versatile tool for different types of traders and investors, whether you are a short-term day trader or a long-term portfolio manager.
The utility of DeMARK’s system extends beyond simple buy/sell signals. It can assist with multiple aspects of trading and investing:
| Utility | Description |
|---|---|
| Idea Generation | Identifying potential turning points can highlight new trading opportunities or signal when to avoid entering a crowded trade. |
| Position Sizing | Signals indicating high probability turns can influence how much capital you allocate to a trade. |
| Portfolio Construction | Understanding potential major shifts can inform decisions about sector allocation or overall market exposure. |
| Risk Management | Anticipating potential reversals allows for tighter stop-loss placement or timely profit-taking, crucial for protecting capital, especially in volatile markets. |
By providing objective, rules-based signals, DeMARK Indicators help remove emotional bias from trading decisions. This disciplined approach is a hallmark of successful long-term trading.
If you’re exploring different financial markets, including currencies, to apply technical analysis like DeMARK’s methods, choosing the right platform is essential. Moneta Markets is an Australian-based platform that offers access to over 1000 financial instruments, including forex, providing a robust environment for both new and experienced traders utilizing technical strategies. Its support for various platforms like MT4, MT5, and Pro Trader, combined with competitive conditions, can enhance your trading experience.
Among the various tools within the DeMARK Indicators suite, the countdown methodology is particularly well-known and frequently referenced in DeMark’s analysis, including his current S&P 500 forecast. The countdown process is designed to identify the final stages of a price move, signaling that trend exhaustion is imminent and a reversal is highly probable.
While the specifics are proprietary and involve precise sequencing rules based on comparisons of current closes to closes four periods prior, the general concept is that the market must complete a specific sequence of price activity to satisfy the countdown criteria. It’s not just about reaching a certain price level; it’s about the *pattern* and *sequence* of price bars over time.
When a market, like the S&P 500, completes a full countdown sequence (which often ends at 13, but varies depending on the specific setup), it generates a powerful sell signal (or a buy signal at a bottom). This signal suggests that the current trend has exhausted its underlying strength and is ripe for a reversal. DeMark has indicated that the S&P 500 has recently shown signs of nearing the completion of such a sequence. Specifically, his analysis pointed to the index having reached a “seventh occurrence” in the countdown process. What does this mean? It suggests the sequence is well underway, and the market is approaching the point where the final signal could be triggered.
According to DeMark’s recent commentary, achieving two more new closing highs on the S&P 500 could be the specific condition that completes the countdown and triggers a definitive sell signal based on this market timing model. This provides investors with a concrete, objective condition to watch for, rather than relying on subjective interpretations or hoping for a specific piece of news. It’s a powerful example of how DeMARK Indicators seek to quantify market behavior to pinpoint potential turning points.
Beyond the specific countdown methodology signals, Tom DeMark also points to broader technical conditions that reinforce his bearish outlook for US stocks. He notes the presence of “technical damage” within the market structure. This can refer to various underlying signs of weakening health, such as divergences between price and momentum indicators, deteriorating internal market breadth (fewer stocks participating in the rally), or failure at key resistance levels on different timeframes.
Furthermore, DeMark highlights the market’s current “fragility.” Despite reaching new highs, the market may be vulnerable to external shocks or shifts in sentiment. A fragile market structure implies that buying pressure is not robust enough to absorb significant selling, making it susceptible to sharp and rapid declines if a catalyst emerges. This fragility is compounded by the fact that many investors may be complacent after a prolonged uptrend, leading to increased risk-taking and a lack of hedging.
What could be a potential catalyst for such a decline? DeMark specifically mentions the vulnerability to changes in the global trade outlook. Geopolitical tensions, shifts in trade policies, or unexpected developments on the international stage have the potential to rapidly alter market sentiment and trigger risk-off behavior. In a fragile market environment already showing signs of trend exhaustion according to DeMARK Indicators, such external factors could exacerbate a downturn, potentially accelerating the move towards a bear market.
This perspective underscores that while DeMARK’s system is primarily technical, he also considers the macro environment as a potential trigger for the reversals his indicators are anticipating. It’s a blend of rigorous technical analysis with an awareness of external factors that could validate or accelerate the expected moves.
Tom DeMark’s analysis also incorporates a deep understanding of market psychology and historical patterns. A key principle he often highlights is that financial markets typically bottom during periods of dire news, overwhelming negativity, and investor capitulation. Think back to major market bottoms – they rarely occur when headlines are positive and sentiment is buoyant. Instead, they form when the news is overwhelmingly bad, when investors have given up hope, and forced selling leads to panic.
This perspective is particularly relevant when considering the current environment, where rallies can sometimes be fueled by optimistic headlines, such as positive developments on the trade front. While such news might provide temporary boosts, DeMark’s indicators look beyond the news cycle to the underlying price dynamics that signal true strength or weakness. A rally based on potentially transient positive news might not negate the technical signals of trend exhaustion identified by the countdown methodology or other DeMARK Indicators.
From this historical viewpoint, a potential bear market and subsequent bottom would likely coincide with a period of widespread negative sentiment and news. This contrasts sharply with the positive sentiment that often accompanies market tops, where investors are typically bullish and optimistic. DeMark’s system helps cut through this sentiment by providing objective signals based purely on price action, allowing traders to prepare for potential shifts even when the prevailing mood is euphoric or fearful.
How can investors and traders practically incorporate DeMARK Indicators into their own strategies? First, it’s important to understand that DeMARK’s system is complex and often requires dedicated software, such as Symbolik by DeMARK or platforms licensed to include DeMARK analysis, to calculate and visualize the signals accurately. These are not indicators found in basic charting packages.
Once you have access to the tools, the key is to use the market timing signals generated by the indicators (like setup, consolidation, and countdown signals) to inform your trading decisions. These signals can help you:
| Application | Details |
|---|---|
| Anticipate Entry Points | Look for buy signals (e.g., a completed countdown to the downside) at potential bottoms to initiate long positions. |
| Anticipate Exit Points | Look for sell signals (e.g., a completed countdown to the upside) at potential tops to exit long positions or initiate short positions. |
| Confirm Other Analysis | Use DeMARK signals in conjunction with other forms of technical analysis or fundamental analysis to build conviction in your trading ideas. |
| Manage Risk | Place stop-losses strategically based on the levels where DeMARK signals would be invalidated. |
For example, if the S&P 500 does complete the countdown sequence and generate a sell signal as DeMark suggests is likely, this signal could be used by traders as a trigger to reduce equity exposure, hedge existing positions, or even establish short positions in anticipation of the forecast decline towards bear market territory.
Successfully implementing DeMARK analysis requires practice and a deep understanding of the specific rules governing each indicator. It’s not a magic bullet but a sophisticated tool that, when applied correctly, can offer a unique edge in identifying potential market turning points.
If you are exploring platforms to apply sophisticated technical analysis like DeMARK’s methods across various markets, including potentially using tools or data feeds that incorporate such indicators, consider the options available. Moneta Markets is regulated by multiple authorities, including the FSCA, ASIC, and FSA, offering a global trading environment with features like segregated funds and 24/7 support. This level of support and regulation can be crucial when dealing with complex analysis and strategies.
The credibility of Tom DeMark‘s analysis stems not only from the robustness of his indicators but also from his extensive experience and proven track record. Over five decades, he has advised some of the most prominent names in the investment world, including legendary investors like Paul Tudor Jones, Leon Cooperman, and Steve Cohen. The fact that these highly successful individuals have sought and utilized DeMark’s insights speaks volumes about the perceived value and reliability of his methodology.
Furthermore, DeMark and his company, DeMARK Analytics, are regularly featured in major financial media outlets. Appearances and coverage in publications and networks such as Bloomberg, MarketWatch, CNBC, and Forbes demonstrate the widespread recognition and respect for his expertise within the financial community. This media presence not only broadens awareness of his work but also subjects his forecasts to public scrutiny, further reinforcing the need for accuracy.
His recent accurate calls on the S&P 500 – timing the peak in February and the subsequent low in April – are the most recent examples bolstering his reputation. While past performance is never a guarantee of future results, such precise calls provide tangible evidence of the DeMARK Indicators‘ potential effectiveness in identifying significant market turning points. This history of successful predictions adds significant weight to his current warning about a potential bear market in US stocks.
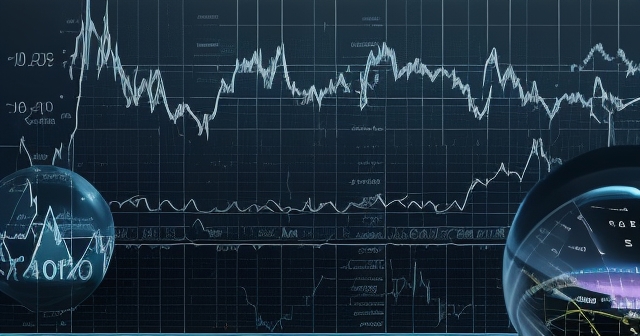
How do DeMARK Indicators differ from more conventional analysis methods that many traders are familiar with? While both fall under the umbrella of technical analysis, their core philosophies and approaches to market timing are distinct. Conventional tools like moving averages, MACD, RSI, or Bollinger Bands are primarily momentum or trend-following indicators. They help you identify the direction and strength of an existing trend, and some can signal when a trend might be overextended or due for a correction.
However, these tools often generate signals *after* a trend is well underway or *after* a reversal has already begun. They are excellent for confirming trends but less effective at *anticipating* the precise points where trends exhaust themselves and reverse. DeMARK Indicators, on the other hand, are specifically designed for this anticipatory function. By analyzing sequences and relationships between price bars in a mathematically rigorous way, they aim to identify the points of maximum pressure where a trend is most likely to culminate.
Think of it this way: a moving average tells you the average price over a period, indicating the general direction. RSI tells you if a market is potentially overbought or oversold. These are useful snapshots. DeMARK Indicators, particularly the countdown methodology, are looking at the *pattern* leading up to an overbought/oversold condition, quantifying how many consecutive periods of buying or selling pressure the market has absorbed in a specific sequence, and signaling precisely when that sequence is likely nearing its end. This allows for potentially earlier and more precise entry or exit points compared to methods that wait for confirmation.
This difference in approach means that DeMARK Indicators can sometimes provide signals that seem counter-intuitive based on simpler indicators, especially near tops and bottoms where sentiment is extreme. Mastering these indicators requires understanding their unique logic and not trying to force them to fit into a conventional framework.
While powerful, DeMARK Indicators are not without their challenges. First, as mentioned, the system is proprietary and requires specialized software or data feeds. Accessing and properly utilizing these tools involves a learning curve and potentially associated costs.
Second, interpreting the signals correctly is crucial. The system has precise rules, and misapplication can lead to incorrect conclusions. Like any sophisticated technical analysis tool, it requires study and practice to master. DeMark’s own expertise comes from decades of observing and refining his methods.
Third, while DeMARK Indicators aim to be objective and mathematically based, no indicator is perfect, and false signals can occur. Markets are complex, and while the indicators identify high-probability setups for trend exhaustion and price inflection, they do not guarantee reversals. Therefore, using DeMARK signals in isolation is often less effective than using them as part of a broader trading plan that includes risk management, position sizing, and potentially other forms of analysis.
Finally, even if a major market turning point is accurately predicted by the DeMARK Indicators, the exact magnitude and duration of the subsequent move can still vary. For instance, a sell signal could lead to a deep bear market or a more shallow correction. The indicators primarily focus on the timing of the turn, providing less information about the subsequent price path.
Despite these challenges, for traders and investors willing to invest the time and resources, DeMARK Indicators offer a unique and powerful approach to market timing that differs significantly from mainstream methods and has a history of identifying critical turns.
Understanding Tom DeMark‘s work through the lens of EEAT (Experience, Expertise, Authoritativeness, Trustworthiness) helps solidify its importance. Let’s break this down:
- Experience: DeMark’s five decades in the market provide an unparalleled depth of experience, having witnessed numerous cycles, crises, and technological shifts. This long history informs the development and application of his indicators.
- Expertise: He is not just a market observer but a developer of a sophisticated, proprietary system based on complex mathematical relationships. His deep understanding of price action, sequences, and trend exhaustion constitutes a high level of specialized expertise.
- Authoritativeness: DeMark’s methodologies are widely recognized and used by institutional investors and hedge funds globally. His company, DeMARK Analytics, is a respected provider of analysis and tools. His frequent appearances in top-tier financial media further establish his authority in the field of market timing.
- Trustworthiness: While past performance is no guarantee, DeMark’s documented history of accurate predictions, such as the recent S&P 500 calls, builds trust in the reliability of his system’s signals. The transparency of his calls through media interviews allows his analysis to be tracked and verified over time.
For anyone seeking to understand market dynamics and potential turns, considering analysis from sources that clearly demonstrate EEAT principles is vital. Tom DeMark‘s long career, specialized methodology, high-profile clientele, and media presence firmly place his work within this category, making his current bear market warning for US stocks a signal worth serious consideration.
Tom DeMark, leveraging his half-century of experience and his sophisticated DeMARK Indicators, is issuing a clear and compelling warning: the US stocks market, particularly the S&P 500, is showing significant signs of trend exhaustion and is poised for a potential downturn that could lead to a formal bear market. His forecast for a drop below 4835 on the S&P 500 is specific and based on the objective signals generated by his proprietary system, including the countdown methodology.
While recent market optimism might seem to contradict this forecast, DeMark’s analysis reminds us that market timing signals based on underlying price inflection dynamics often precede major shifts in sentiment and news flow. His track record, coupled with the endorsement of prominent investors and regular features in major financial media, underscores the credibility of his work.
For both new and experienced investors, DeMark’s warning serves as a valuable prompt to assess your current portfolio’s exposure to US stocks and review your risk management strategies. While you may not utilize DeMARK Indicators yourself, being aware of the insights generated by this respected methodology provides a different perspective than relying solely on conventional analysis or market sentiment. It highlights the potential for significant market turning points even when the prevailing narrative is positive.
As the market approaches the conditions that could trigger the sell signal anticipated by the countdown methodology, staying informed and prepared is paramount. Whether you choose to incorporate advanced technical analysis like DeMARK’s, diversify across asset classes, or simply adjust your exposure, understanding the potential for a significant shift is the first step in navigating what could become turbulent waters.
Ultimately, the goal of adopting sophisticated analysis tools like DeMARK’s, or even just understanding their implications, is to gain an edge in a competitive market. By anticipating potential shifts rather than merely reacting to them, investors can potentially improve their entry and exit points, manage risk more effectively, and work towards realizing their investment goals, aligning with the mission of empowering investors through accessible professional knowledge.
demarker indicatorFAQ
Q:What are DeMARK Indicators?
A:DeMARK Indicators are a proprietary system developed by Tom DeMark designed to anticipate changes in market trends and identify potential price inflection points based on mathematical relationships.
Q:How can DeMARK Indicators be used in trading?
A:Traders can use DeMARK Indicators to inform their trading decisions, manage risk, and optimize portfolio exposure by identifying potential entry and exit points.
Q:Are DeMARK Indicators suitable for all types of markets?
A:Yes, DeMARK Indicators are universally applicable across various asset classes, including stocks, commodities, currencies, and more, making them versatile for different trading strategies.