“`html
Mastering Global Economics: Unpacking the Big Mac Index
Welcome to our exploration of global economics, where complex theories often find surprisingly simple illustrations. Today, we’re diving into one of the most widely recognized, albeit informal, economic tools ever created: the Big Mac Index. Perhaps you’ve heard of it, or maybe you’re wondering how a fast-food hamburger relates to international finance and currency valuation. We’re here to break it down, demystify the concept, and show you why this humble index has captured the attention of economists, journalists, and curious minds worldwide for decades. Think of us as your guide through the fascinating world of “Burgernomics.”
We’ll explore its origins, understand its methodology, appreciate its insights, and acknowledge its limitations. By the end of this journey, you’ll not only grasp the core idea behind the Big Mac Index but also see how it fits into the broader landscape of global economic indicators. Whether you’re an investor looking to understand currency dynamics better or simply someone with a keen interest in how the world’s economies compare, this guide is designed for you. Let’s bite into it!
Every significant concept often has a clear starting point, and for the Big Mac Index, that point is 1986. It wasn’t born in a stuffy academic journal or a central bank’s research paper. Instead, it debuted in the pages of the esteemed British magazine, The Economist. Can you imagine? A publication known for its rigorous analysis decided to use a fast-food item to explain a fundamental economic theory.
The driving force behind its creation was Pam Woodall, a journalist seeking a simple way to illustrate the concept of Purchasing Power Parity (PPP). She needed something universally available, relatively standardized, and priced locally. What fits that description better than a McDonald’s Big Mac? It’s a product found in thousands of locations across the globe, made with largely similar (though not identical) ingredients and processes, and priced in the local currency.
The name “Burgernomics” quickly emerged as a colloquial term to describe the index and the lighthearted but insightful economic analysis it enabled. While initially intended as a “tongue-in-cheek” exercise – a digestible explanation of complex exchange rate theory – its elegance and simplicity resonated deeply. It offered a relatable benchmark against which to measure the relative cost of living and, by extension, the potential value of different currencies. From that point on, the Big Mac Index became a regular feature, updated periodically by The Economist, tracking the price of the iconic burger in dozens of countries and currency areas.
| Year | Country | Price of Big Mac (Local Currency) | Implied PPP Exchange Rate |
|---|---|---|---|
| 2024 | USA | $5.58 | – |
| 2024 | UK | £4.19 | £0.75 per $1 |
| 2024 | Switzerland | SFr 6.70 | SFr 0.87 per $1 |
At the heart of the Big Mac Index lies the economic theory of Purchasing Power Parity (PPP). It’s a concept that sounds complex but is quite intuitive once you break it down. PPP is based on the Law of One Price. This law states that in efficient markets, identical goods should trade for the same price when expressed in a common currency, assuming there are no transportation costs, trade barriers, or other impediments.
Imagine you can buy a specific loaf of bread in Country A for $2. According to the Law of One Price, if the exchange rate between Country A’s currency and Country B’s currency makes that same loaf of bread cost $3 in Country B, then something is potentially off with the exchange rate. PPP suggests that the exchange rate between two currencies should adjust over time so that a ‘basket of goods’ costs the same in both countries when measured in a common currency.
Here are the main points regarding Purchasing Power Parity:
- It aims to measure how much a currency can purchase in its local context.
- The index uses a common good (Big Mac) as the basis for comparison.
- It emphasizes the concept of equal value of goods across different markets.
So, the idea is to compare the purchasing power of different currencies. If the exchange rate aligns with PPP, your money should buy you roughly the same amount of goods and services, whether you spend it at home or convert it and spend it abroad. The Big Mac Index simply uses a single, convenient item – the Big Mac – as a highly simplified ‘basket of goods’ to test this theory informally. It asks: does the price of a Big Mac, converted to a common currency, reflect what the prevailing exchange rate suggests it should cost?
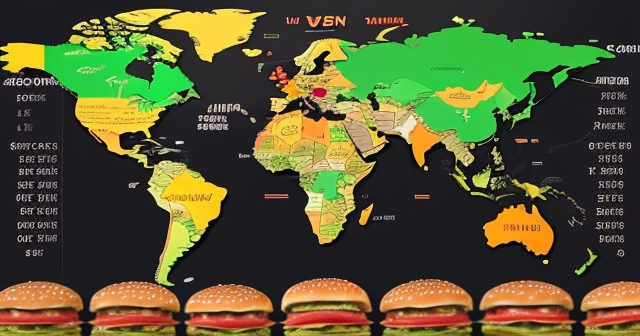
How does The Economist actually turn Big Mac prices into an index that suggests currency value? The process is surprisingly straightforward, relying on a simple division to calculate what’s known as the implied exchange rate based on PPP.
First, you need the price of a Big Mac in two different countries, measured in their respective local currencies. Let’s say we’re comparing the price in the United States and the United Kingdom.
- Price of a Big Mac in the US (in USD)
- Price of a Big Mac in the UK (in British Pounds)
Next, you calculate the implied PPP exchange rate. You do this by dividing the price of the Big Mac in one currency by the price of the Big Mac in the other currency.
For instance, if a Big Mac costs $5.58 in the US and £4.19 in the UK (using approximate figures from mid-2024):
Implied PPP Exchange Rate (£ per $) = Price in UK (£) / Price in US ($) = £4.19 / $5.58 ≈ £0.75 per $1
This calculation tells you what the exchange rate *should* be according to the Law of One Price, based solely on the cost of a Big Mac. In this hypothetical example, it suggests that according to Burgernomics, 1 US dollar should be able to buy you roughly 0.75 British Pounds.
The next crucial step is to compare this implied exchange rate to the actual market exchange rate that you would find if you were to exchange dollars for pounds at a bank or through a currency broker. This comparison is what reveals the potential overvaluation or undervaluation of a currency according to the index. We’ll delve into that comparison next.
Now that we have the implied PPP exchange rate derived from Big Mac prices and the actual market exchange rate, we can use the Big Mac Index to assess whether a currency is potentially overvalued or undervalued relative to another, typically the U.S. dollar as the common base currency used by The Economist.
Let’s continue with our US vs. UK example. We found an implied PPP rate of approximately £0.75 per $1. Suppose the actual market exchange rate at that time was £0.80 per $1.
Here’s the comparison:
- Implied PPP Rate: £0.75 per $1
- Actual Market Rate: £0.80 per $1
According to the implied rate, it should take £0.75 to buy $1 worth of goods (a Big Mac). However, the actual market rate says it takes £0.80 to buy $1. What does this mean?
| Comparison | Implied Rate (£/$) | Actual Market Rate (£/$) | Interpretation |
|---|---|---|---|
| US vs. UK | £0.75 | £0.80 | British Pound is weaker than implied |
It means the British Pound is *weaker* relative to the dollar than the price of the Big Mac alone would suggest. If you exchange £0.80, you get $1, which buys you a Big Mac in the US costing $5.58. But if the rate were £0.75/$1, you would only need £0.75 to get $1. In this scenario, the actual market rate of £0.80/$1 suggests that the British Pound buys *less* relative to the dollar than the Big Mac comparison indicates. Conversely, the dollar buys *more* pounds than the Big Mac comparison implies.
To determine the percentage over or undervaluation, we can use this formula:
% Over (+) or Undervalued (-) = ((Actual Exchange Rate – Implied PPP Rate) / Implied PPP Rate) * 100
Using our example:
% Difference for GBP against USD = ((£0.80/$1 – £0.75/$1) / £0.75/$1) * 100 = (£0.05/$1 / £0.75/$1) * 100 ≈ (0.0667) * 100 ≈ 6.7%
Wait, is that calculation right? Let’s re-think how The Economist usually presents this. They typically show how much cheaper or more expensive a Big Mac is in dollars when bought abroad compared to the US price, using the *actual* exchange rate. A simpler calculation to understand over/undervaluation relative to the base currency (USD) is:
Take the Big Mac price in the local currency (e.g., £4.19) and convert it to the base currency (USD) using the actual market exchange rate (e.g., $1 = £0.80 or £1 = $1.25). Price in USD (UK) = Price in GBP (£4.19) / Actual Market Rate (£ per $) = £4.19 / £0.80 per $1 = $5.24
Compare this converted price ($5.24) to the actual US price ($5.58). Difference = ($5.24 – $5.58) / $5.58 * 100 ≈ -$0.34 / $5.58 * 100 ≈ -6.1%
This means that, using the actual exchange rate, a Big Mac in the UK ($5.24) is about 6.1% cheaper in dollar terms than a Big Mac in the US ($5.58). According to the Big Mac Index, this suggests the British Pound is undervalued by about 6.1% against the US dollar. Conversely, if a Big Mac converted to USD was more expensive than the US price, the local currency would be considered overvalued.
For instance, in July 2023, a Big Mac in Switzerland cost SFr 6.70, while in the US it was $5.58. The actual exchange rate was approximately SFr 0.87 per $1. Price in USD (Switzerland) = SFr 6.70 / SFr 0.87 per $1 ≈ $7.70. Difference = ($7.70 – $5.58) / $5.58 * 100 ≈ $2.12 / $5.58 * 100 ≈ 38%.
This suggests the Swiss Franc was overvalued by about 38% against the US dollar according to the index. This simple calculation provides a snapshot of potential currency misalignment, though it’s crucial to remember this is a highly simplified model.
Why is the price of a Big Mac considered a useful, albeit rough, indicator? Because the final price you pay for a Big Mac isn’t just about the cost of the beef patties and the sesame seed bun. It’s a reflection of numerous local economic factors that contribute to its production and sale within a specific country. Think of it as a mini ‘basket of goods and services’ embedded within a single product.
Here are key factors that influence Big Mac prices:
- Local Ingredient Costs: The price of beef, lettuce, cheese, and bread sourced locally or imported.
- Labor Wages: The cost of paying the staff who assemble and serve the burger.
- Rent and Utilities: The cost of operating the restaurant, including rent, electricity, and water.
- Taxes: Value-added tax (VAT) and sales tax that may vary by region.
- Franchise Fees and Royalties: Payments made to McDonald’s corporation, affecting local pricing.
- Local Competition and Pricing Strategy: How McDonald’s prices the Big Mac relative to competitors.
| Pricing Factor | Description |
|---|---|
| Local Ingredient Costs | Reflects local agricultural conditions and trade policies. |
| Labor Wages | Varies based on local minimum wage levels and productivity. |
| Rent and Utilities | Costs differ between urban and rural areas and across countries. |
Because the Big Mac incorporates these diverse local costs, its price offers a rough proxy for the overall cost of non-tradable goods and services (like labor and rent) within that economy, combined with the cost of tradable goods (ingredients). This blend makes it a more comprehensive, albeit still limited, indicator than simply comparing the price of a single commodity like a loaf of bread. It provides a real-world glimpse into the local economic environment and the purchasing power of the local currency regarding a mix of inputs.
Given its limitations, you might wonder why the Big Mac Index has endured and gained such widespread recognition. Its primary strength lies in its ability to take a complex economic theory – Purchasing Power Parity and exchange rate valuation – and make it incredibly digestible and relatable for a global audience. Most people, whether in Tokyo, Timbuktu, or Toronto, have at least heard of McDonald’s, if not eaten a Big Mac.
Here are some key reasons for its utility:
- Accessibility: You don’t need access to sophisticated economic databases to understand the core concept.
- Relatability: A Big Mac is a tangible, everyday item that resonates intuitively.
- Quick Snapshot: Provides a fast, informal snapshot of potential currency misalignment.
- Teaching Tool: An excellent educational resource for explaining PPP and exchange rates.
- Conversation Starter: Popular topic for discussions about global prices and travel.
While it’s not a tool for precise forecasting or rigorous academic research, the Big Mac Index excels at doing exactly what its creators intended: making economics, specifically exchange rate theory, more comprehensible and engaging. It highlights the fact that exchange rates don’t always perfectly reflect the relative costs of goods and services on the ground, providing a starting point for understanding global economic disparities.
As much as we appreciate the Big Mac Index for its simplicity and insight, it’s absolutely essential to recognize its significant limitations. Treating it as a precise scientific instrument for determining currency values would be misleading and potentially harmful for actual investment decisions. Remember, it was initially a “tongue-in-cheek” exercise.
Here are some key areas where the Big Mac Index falls short as a perfect measure of PPP or currency valuation:
- Standardization is Imperfect: Ingredients and sizes may vary globally.
- Non-Tradable Costs Dominate: Many costs are tied to local conditions.
- Market Efficiency Assumptions: The Law of One Price assumes no barriers.
- Geographic Coverage Issues: Limited coverage in some countries.
- Single Product Bias: Ignores a broader basket of goods.
- Ignoring Economic Complexity: Exchange rates are influenced by various factors.
Therefore, while the index is great for illustrating concepts and highlighting potential disparities, it cannot be used in isolation to make definitive judgments about whether a currency is “truly” over or undervalued for trading purposes. It’s a starting point for analysis, not the conclusion.
Building on the limitations, it’s crucial to understand that the real world of international trade and finance introduces complexities that Burgernomics simply cannot capture. The price of a Big Mac in a specific country is not just determined by its production costs and an ideal PPP exchange rate. It’s also shaped by the competitive landscape, local consumer demand, and government policies.
Consider the impact of local competition. In some markets, McDonald’s might face intense price competition from local fast-food chains, forcing it to lower prices. This could make local currency appear more undervalued than it actually is. Conversely, in less competitive markets, McDonald’s might charge a premium, suggesting a stronger currency.
Trade barriers, tariffs, and import restrictions also play a significant role. If a country imposes high tariffs, the cost of producing a Big Mac will increase, artificially inflating local prices and making currency appear overvalued.
Furthermore, local demand and income levels can influence pricing. In countries with lower incomes, McDonald’s may lower prices to ensure affordability, unrelated to production costs. These factors demonstrate that the Big Mac Index provides a simplified view, neglecting strategic pricing, tariffs, and market dynamics.
Sometimes, people might confuse the Big Mac Index with more formal economic indicators like the Consumer Price Index (CPI). While both involve looking at prices, they serve fundamentally different purposes and measure different things.
The CPI is crucial for measuring inflation – the overall increase in prices over time. It tracks a broad basket of consumer goods and services, providing a comprehensive view of household spending behavior.
The Big Mac Index focuses on cross-country comparisons of purchasing power and potential currency valuation, using just one item. It does not track price changes within a country to measure inflation. Both serve different economic inquiries, providing valuable but distinct data points.
The Big Mac Index’s success in making complex concepts accessible has inspired numerous imitators and variations over the years. Other “informal indices” include:
- The Starbucks Index: Compares coffee prices across countries.
- The iPod Index: Price comparisons of Apple products globally.
- The Billy Index: Comparing IKEA bookshelf prices for market conditions.
- The Gold-Mac-Index: Compares Big Mac prices with gold prices.
These alternative indices share the strengths of relatability and simplicity, as well as limitations related to single-product bias and local market conditions.
Understanding potential currency misalignment based on indicators like the Big Mac Index is a foundational step for engaging with global financial markets. If you’re exploring platforms for foreign exchange trading, finding one that offers comprehensive tools is key.
If you’re considering beginning foreign exchange trading, Moneta Markets is a platform worth considering. Hailing from Australia, it offers over 1000 financial instruments, making it suitable for both new and experienced traders.
Perhaps the most enduring legacy of the Big Mac Index is its role as a global conversation starter. It has successfully brought dry economic concepts like Purchasing Power Parity into mainstream discussion. News articles and social media frequently reference the latest figures, illustrating cost of living comparisons.
It encourages critical thinking about price variations across borders when expressed in a common currency. It prompts questions like: Why is a Big Mac more expensive in Switzerland than in the U.S.? Does this reflect economic realities or merely pricing strategies?
While the index itself doesn’t provide all the answers, it excels at posing these questions and motivating people to explore the intricacies of different economies. It serves as a compelling reminder of the complex and fascinating nature of the economic landscape.
For those interested in trading global markets, understanding these real-world economic indicators is valuable. While the Big Mac Index won’t yield precise trading signals, it helps build intuition about currency strength and valuation trends.
When choosing a trading platform, Moneta Markets‘ flexibility and technological advantages are worth mentioning. It supports mainstream platforms like MT4, MT5, and Pro Trader, ensuring a positive trading experience.
In conclusion, the Big Mac Index is far more than just a quirky comparison of hamburger prices. It’s a brilliant, informal tool that has successfully demystified the economic theory of Purchasing Power Parity for a global audience. Created by The Economist, it uses the universally recognized McDonald’s Big Mac as a simplified benchmark to illustrate how exchange rates could theoretically adjust to equalize prices across borders and, by comparing this ‘implied’ rate to the actual market rate, offers a digestible indicator of potential currency over or undervaluation.
While it serves as an excellent educational aid and a catalyst for discussion about global economic disparities and the cost of living, it is crucial to use it with awareness of its inherent limitations. It’s not a precise predictor of exchange rate movements or a comprehensive measure of inflation. Its reliance on a single product means it provides a simplified snapshot, not definitive analysis.
Ultimately, the Big Mac Index endures because it’s relatable, accessible, and effective at sparking interest in global economics. It reminds us that even complex concepts can be illustrated with everyday examples. For investors and traders, it offers a supplementary perspective – a quick, informal gauge that can complement more rigorous analysis of economic fundamentals.
big mac index definitionFAQ
Q:What is the Big Mac Index?
A:The Big Mac Index is an informal measure of currency valuation based on the price of a Big Mac worldwide.
Q:How is the Big Mac Index calculated?
A:It compares the prices of Big Macs in different countries to determine if currencies are overvalued or undervalued.
Q:What are the limitations of the Big Mac Index?
A:It relies on a single product, doesn’t account for local economic variations, and is not a precise measure of currency valuation.
“`
