Beyond the Smoothness: Unpacking the Significant Disadvantages of Heikin Ashi Charts
Welcome, fellow traders, to a deeper dive into the world of technical analysis. You’ve likely encountered Heikin Ashi charts, perhaps drawn to their visually smooth appearance compared to the traditional jagged nature of standard candlesticks. They promise a clearer view of trends, filtering out much of the market noise that can confuse new and experienced traders alike. And indeed, for certain applications, Heikin Ashi can be a powerful tool for identifying trend direction and potential reversals.
However, like any tool in your trading arsenal, Heikin Ashi comes with its own set of significant limitations and disadvantages. Relying solely on these smoothed candles without fully understanding what information they are obscuring can lead to critical errors in judgment, poor trade execution, and ultimately, financial losses. Our goal here is to provide you with the in-depth knowledge – the kind a sage imparts – so you can use Heikin Ashi wisely, or understand why it might not be the right tool for your specific trading style, particularly if you’re focused on precision and rapid market movements.
This is perhaps the most fundamental, yet often overlooked, drawback of the Heikin Ashi charting method. Unlike traditional Japanese candlesticks, which plot the exact open, high, low, and close price that occurred during a specific time period, Heikin Ashi candles are derived values. They are calculated using formulas that incorporate data from the previous period’s Heikin Ashi candle and the current period’s actual price data. This averaging process is precisely what creates the smooth appearance, but it also means the price displayed by a Heikin Ashi candle might not be a price where any actual trade took place.
| Heikin Ashi Candle Calculation | Formula |
|---|---|
| Heikin Ashi Close (HA_Close) | (Actual Open + Actual High + Actual Low + Actual Close) / 4 |
| Heikin Ashi Open (HA_Open) | (HA_Open from previous candle + HA_Close from previous candle) / 2 |
| Heikin Ashi High (HA_High) | The maximum of (Actual High, HA_Open, HA_Close) |
| Heikin Ashi Low (HA_Low) | The minimum of (Actual Low, HA_Open, HA_Close) |
Notice how the HA_Open and HA_Close are heavily influenced by previous periods. The HA_High and HA_Low do consider the actual high and low, but their positioning relative to the HA_Open and HA_Close is determined by the averaged values. This is drastically different from a traditional candlestick, where the open, high, low, and close are hard, verifiable transaction prices within that single period.
What are the practical implications of this? When you look at a traditional candlestick chart, the close price is the price at which the asset ended the period – a crucial piece of information for many strategies, especially those involving closing price breakouts or indicator calculations based on the close. On a Heikin Ashi chart, the HA_Close is just an average, potentially far from the actual closing price. Similarly, the HA_Open is an average of previous values, bearing little relation to the actual opening price of the current period.
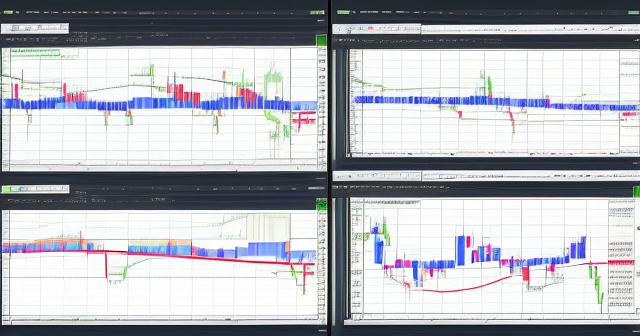
Consider a scenario where a traditional candle shows a strong move up, closing significantly higher than it opened (a bullish engulfing or a large green candle). The corresponding Heikin Ashi candle might still be red, showing a continuation of a downward trend, because the averaging formula, incorporating previous red candles, pulls the current HA_Close down. This fundamental difference means Heikin Ashi charts do not provide a direct, accurate representation of where the market traded during a specific period. You’re looking at a smoothed interpretation, not the raw data.
The Inherent Lag: Heikin Ashi as a Delayed Indicator
Because the calculation of a Heikin Ashi candle incorporates data from the previous candle, particularly for the opening price, Heikin Ashi is by definition a lagging indicator. It’s like looking in a slightly delayed mirror of the market. The smoothing effect, while great for filtering noise, means that true price movements, especially sharp reversals or bursts of momentum, will appear later on a Heikin Ashi chart than they would on a traditional candlestick chart.
| Impact of Lagging Indicator | Description |
|---|---|
| Delayed Signals | Trend reversal signals become visible after significant movement has occurred. |
| Poor Entry Points | Potential entry points may appear later than optimal, reducing profit potential. |
| Inaccurate Trend Changes | Clear trend changes may take several candles to manifest, leading to missed opportunities. |
Think of it this way: a traditional candle reacts instantly to the price action within its period. If the price spikes dramatically, the candle reflects that spike immediately. A Heikin Ashi candle, however, has its opening price based on the *previous* candle’s open and close average. This averages in older data, slowing down its reaction to the current market sentiment and price shift. The HA_Close is also an average, further smoothing and delaying the signal.
This lagging nature affects everything from identifying potential trend changes to spotting entry and exit points. A trend reversal signal that might be visible early on a traditional chart – perhaps a specific candlestick pattern like a hammer or a bearish engulfing pattern, or a clear break of a short-term trendline using actual price points – may take several more candles to materialize on a Heikin Ashi chart. By the time the Heikin Ashi candles clearly signal the change (e.g., turning from a long series of green candles to a series of red ones), a significant portion of the move may have already occurred.
For strategies that rely on anticipating or catching the very beginning of a price move, this lag is a significant drawback. It means potential entry points signaled by Heikin Ashi might be later than optimal, reducing the potential profit for the trade. Similarly, exit signals might appear with a delay, leading to giving back gains or taking larger losses than necessary.
Limited Suitability for Fast-Paced and Short-Term Trading Styles
The lagging nature and the absence of true price representation make Heikin Ashi charts generally not suitable for trading styles that demand precision and rapid execution based on real-time price action. We’re talking specifically about:
- Day Trading: Traders who open and close positions within the same trading day need to react quickly to intraday volatility, price levels, and momentum shifts. The delayed signals and averaged prices of Heikin Ashi can cause them to miss entries, get in late, or be slow to exit positions, which is critical in the tight timeframes and leverage often used in day trading.
- Scalping: This is the fastest trading style, involving holding positions for mere seconds to minutes to capture tiny price movements. Scalpers rely heavily on Level II data, order flow, and precise entry/exit points often determined by single tick movements or micro-fluctuations around key levels. Heikin Ashi’s smoothed, delayed data is fundamentally incompatible with the real-time, high-precision needs of scalping. You simply cannot scalp effectively based on averaged, lagged prices that don’t reflect the actual bids and asks in the market.
| Trading Style | Challenges with Heikin Ashi |
|---|---|
| Day Trading | Delayed signals may result in missing key entries or exits. |
| Scalping | Cannot effectively react to micro-fluctuations due to averaging. |
Imagine you are day trading a volatile currency pair like EUR/USD. A sudden news event causes a rapid spike or drop. A traditional chart shows this immediate price surge or plunge clearly with long candles and gaps. A Heikin Ashi chart will smooth this out. The change in color or body size might only occur after several periods, by which time the initial rapid move has already happened. For a day trader needing to enter or exit *during* that rapid move, Heikin Ashi offers little immediate, actionable insight.
While Heikin Ashi might be useful for swing trading or position trading, where holding periods are longer and filtering short-term noise is more important, its disadvantages become glaringly apparent when you move to shorter timeframes and require higher precision.
If you’re exploring short-term opportunities, especially in currency markets where speed matters, understanding the tools that provide real-time data is key. If you’re considering starting forex trading or exploring CFDs, platforms like Moneta Markets are worth considering. They are based in Australia and offer over 1000 financial instruments, catering to both beginners and professional traders, potentially offering the precise data feeds short-term strategies demand.
Obscuring Vital Market Information: Price Gaps and Specific Levels
One of the most significant pieces of information that Heikin Ashi charts hide is price gaps. On a traditional candlestick chart, a gap occurs when the opening price of a period is significantly higher or lower than the closing price of the previous period, leaving a visible “gap” on the chart. Gaps are important indicators of strong sentiment, sudden news reactions, or shifts in supply and demand. They can act as areas of support or resistance and are key components of certain trading strategies (like gap-and-go or gap fill). However, due to the averaging calculation that ensures the HA_Open is always midway between the previous candle’s HA_Open and HA_Close, Heikin Ashi charts do not display true price gaps.
The opening price of a Heikin Ashi candle will always be connected to the body of the previous candle, eliminating the visual representation of actual market gaps. By smoothing away these gaps, Heikin Ashi removes valuable visual cues about market conviction and potential future price behavior that traditional charts provide. Traders relying solely on Heikin Ashi might completely miss the implications of a significant gap that occurred overnight or over a weekend.
Furthermore, while Heikin Ashi shows the actual high and low of the period in its wick, the body of the candle (defined by the HA_Open and HA_Close) does not sit at the actual opening and closing prices. This makes it difficult to identify and trade off precise price levels like:
- Exact Support and Resistance Levels: Support and resistance are often formed by previous price highs, lows, or closing prices where buying or selling pressure was strong. Because Heikin Ashi bodies don’t represent these actual levels, visually identifying and validating key horizontal support and resistance lines based on past significant price points becomes less reliable using only Heikin Ashi. While the wicks show the absolute high and low, the ‘action’ represented by the body is averaged.
- Pivot Points: These are calculated based on the previous day’s actual high, low, and close. Since Heikin Ashi doesn’t display these true values directly, trading strictly based on pivot points becomes challenging when using only a Heikin Ashi chart.
- Fibonacci Retracement/Extension Levels: These are drawn between significant price swing highs and lows. While you can use the actual high/low wicks on Heikin Ashi to draw these, confirming reactions at these levels based on the Heikin Ashi candle bodies is problematic because they aren’t showing true price interaction at those points.
| Trading Challenges | Heikin Ashi Limitations |
|---|---|
| Identifying Support/Resistance | Averaged body makes precise levels unreliable. |
| Calculating Pivot Points | Does not show true previous day values. |
| Drawing Fibonacci Levels | Reactive analysis difficult without true interaction. |
Essentially, the averaging process, while smoothing noise, also smooths away or distorts precise price information that is fundamental to many forms of technical analysis and strategy execution.
Challenges for Risk Management: Placing Accurate Stop-Loss and Take-Profit Orders
Effective risk management is paramount in trading, and a key component is setting appropriate stop-loss and take-profit orders. These orders are placed at specific, actual price levels where you want to exit a trade to limit potential losses (stop-loss) or secure profits (take-profit). Since Heikin Ashi charts do not display the actual open and close prices, and the bodies represent averaged values, using only Heikin Ashi can make it challenging to determine the most logical and precise locations for these orders.
| Order Placement Challenges | Potential Issues |
|---|---|
| Stop-Loss Placement | Average support levels may lead to premature hits. |
| Take-Profit Targets | Targets not based on actual price interactions. |
| Judging Volatility | Size of Heikin Ashi bodies not indicative of actual range. |
Traders often place stop-losses just below a recent low or above a recent high, or beyond a key support or resistance level, based on the actual price action shown by traditional candles. When using Heikin Ashi, the visible low or high (the wick) is the actual value, but the context of the candle’s body relative to that wick is based on averaged prices. This lack of correlation between the averaged body and the actual high/low can lead to:
- Suboptimal Stop-Loss Placement: You might place a stop-loss based on a perceived ‘support’ level indicated by a series of lower Heikin Ashi lows, but without seeing the actual price action (and potential spikes or closes below those lows on a traditional chart), your stop might be too tight and get hit prematurely by market noise that the Heikin Ashi chart filtered out. Conversely, it might be too wide because you can’t see how close the actual price came to a critical level.
- Difficulty in Setting Take-Profit Targets: Similar issues arise with take-profit targets. If you’re targeting a previous swing high or a specific Fibonacci level based on actual prices, the Heikin Ashi chart doesn’t clearly show how price interacted with that level in the past, or how it is interacting now.
- Misjudging Volatility Based on Candle Size: While larger Heikin Ashi bodies generally indicate stronger trend momentum, they don’t directly correlate to the actual price range of the period in the same way a traditional candle body or wick does. A Heikin Ashi candle might appear small and choppy while the actual price experienced significant volatility and range, or vice versa. This can lead to misjudging the stop-loss distance needed to accommodate normal market fluctuations.
Reliable risk management requires anchoring your orders to actual market prices and structural levels. Heikin Ashi’s smoothed representation makes this anchoring process less precise and more prone to error if used without validation from traditional charts.
Potential for Misinterpretation and False Signals if Used in Isolation
Heikin Ashi’s primary strength – smoothing out noise – can also be its weakness if traders are not careful. The smoothed appearance can sometimes mask subtle shifts in momentum or periods of indecision that are clearly visible on a traditional chart. For example, a series of small-bodied traditional candles with long wicks might indicate increasing volatility and potential indecision or a weakening of the trend, even if the price is still grinding in the trend’s direction. A Heikin Ashi chart might just show a continuation of trend color with smaller bodies, making the weakening momentum less obvious.
Furthermore, while Heikin Ashi is excellent for identifying strong trends (long series of same-color candles with no lower/upper wicks), it can be less effective in choppy or range-bound markets. The averaging may still generate alternating green and red candles or small-bodied candles that don’t provide clear directional signals, much like traditional charts in such conditions, but the delay means any potential brief breakout signals might be lagged.
| Misinterpretation Risks | Potential Outcomes |
|---|---|
| Relying on Color Changes | Might execute trades based on delayed trends, missing actual market behavior. |
| False Signals in Consolidation | Could lead to trades based on misleading data amid market noise. |
Crucially, relying *only* on Heikin Ashi signals (like a color change) without confirming them with other indicators or price action analysis from traditional charts can lead to false signals. A Heikin Ashi color change might occur due to the averaging formula catching up or reacting slowly to a minor pullback, only for the overall trend to resume. Without seeing the actual price action, volume (which Heikin Ashi doesn’t show), or other confirming indicators, you might enter or exit a trade based on a signal that traditional analysis would identify as noise or a temporary fluctuation.
For instance, a Heikin Ashi chart might turn red, suggesting a potential bearish move. However, a traditional chart might show that the price is simply testing a strong support level, bouncing off it, and forming a bullish pin bar right at that support. The Heikin Ashi change might just be a delayed reaction to the dip towards support, providing a misleading signal to sell just before the price bounces up.
Heikin Ashi vs. Traditional Candlesticks: A Necessary Comparison
To fully appreciate the disadvantages of Heikin Ashi, it’s vital to constantly compare it with its traditional counterpart. Traditional candlesticks offer:
- Actual Price Data: They show the true open, high, low, and close, giving you precise points where market interactions occurred. This is invaluable for seeing exact levels, spotting gaps, and understanding the true price range and volatility of a period.
- Clear Candlestick Patterns: Traditional charts are the basis for numerous well-known candlestick patterns (engulfing patterns, doji, hammers, shooting stars, etc.). These patterns provide insights into market psychology and potential short-term reversals based on precise open, high, low, and close relationships. While some patterns might loosely translate to Heikin Ashi (e.g., a small body with long wicks showing indecision), the specific, powerful patterns defined by actual prices are lost.
- Real-Time Responsiveness: Traditional candles react immediately to the price action within their period, making them essential for strategies requiring timely entries and exits based on current market conditions.
- Visibility of Gaps: Crucial information about market sentiment and volatility is conveyed through price gaps, which are visible only on traditional charts.
Think of traditional candlesticks as the raw, high-resolution photograph of the market, showing every detail, every fluctuation, every moment of indecision. Heikin Ashi is like that same photograph, but smoothed and filtered to make the main subjects (trends) stand out more clearly, but losing the fine details in the process. Both have their uses, but you need the raw photo for precise measurements, detailed analysis, and spotting things hidden by the filter.
For example, if you are trading Forex, seeing the exact price at which a major currency pair like EUR/USD closed a specific hour or day can be crucial for validating signals or placing orders. Heikin Ashi won’t give you that exact closing price; it gives you an average. This difference can matter significantly in highly competitive and volatile markets.
Why Combination is Key: Heikin Ashi is Not a Standalone Solution
Given these significant limitations – the lack of true prices, inherent lag, unsuitability for fast trading, and obscuring of vital information like gaps and precise levels – it becomes clear that Heikin Ashi should never be used as a standalone trading tool. It is best viewed as a supplementary indicator or a different *view* of the market, rather than a complete charting method in itself.
Effective traders understand the strengths and weaknesses of every tool. Heikin Ashi’s strength is in visualizing the trend and filtering noise. Its weakness is in providing precise, real-time price information. Therefore, the most effective way to use Heikin Ashi is in combination with other forms of analysis:
- Combine with Traditional Candlesticks: Always have a traditional candlestick chart of the same asset and timeframe open alongside your Heikin Ashi chart. Use Heikin Ashi to get a clear visual of the trend direction and momentum (are the bodies getting larger? Are there wicks against the trend?). Then, switch to the traditional chart to confirm potential entry/exit points, identify precise support/resistance levels, spot gaps, and look for traditional candlestick patterns that might validate or contradict the Heikin Ashi signal.
- Combine with Other Technical Indicators: Use Heikin Ashi in conjunction with lagging indicators that confirm trend (like Moving Averages or MACD) or leading/momentum indicators (like RSI or Stochastic Oscillators) that might signal overbought/oversold conditions or divergence before the Heikin Ashi changes color. For instance, a Heikin Ashi might show a strong uptrend, but the RSI shows bearish divergence, hinting that the trend might be weakening before the Heikin Ashi starts showing upper wicks or changes color.
- Combine with Price Action Analysis: Use Heikin Ashi to see the smoothed trend, but perform your actual entry/exit analysis based on price action on the traditional chart – looking at breakouts, retests of levels, and classic candlestick patterns at key areas.
- Consider Volume Analysis: Volume is a crucial indicator of the strength behind a price move. Heikin Ashi charts typically do not incorporate volume information within the candle itself. Always use volume indicators alongside Heikin Ashi to validate the strength of the trend you are seeing.
Using Heikin Ashi in isolation is like trying to navigate a complex city using only a simplified map that shows the main highways but omits all the side streets and specific building numbers. You might get a general sense of direction, but you’ll struggle to find precise locations or react to unexpected road closures (gaps!).
Practical Implications and Real-World Scenarios
Let’s consider a few practical examples of how Heikin Ashi’s disadvantages can play out:
Scenario 1: Missing a Sharp Reversal on News
Imagine a major economic news release for a currency pair like GBP/USD. On a traditional chart, the price instantly reacts with a massive candle moving sharply upwards, potentially gapping up from the previous close. A day trader sees this spike on the traditional chart and might look for a quick pullback to enter a long position, or notice the powerful volume spike accompanying the move. On the Heikin Ashi chart, the candles might still be red or small, slowly starting to turn green after the initial explosive move is already priced in. The lag prevented the trader from reacting to the crucial initial price action based on news.
Scenario 2: False Signal in a Range
Suppose EUR/USD is trading in a tight range. A Heikin Ashi chart might show a brief series of green candles, suggesting a potential bullish breakout. A trader using only Heikin Ashi might buy. However, a traditional chart shows that this brief move was just the price hitting the upper boundary of the range, printing a long upper wick and immediately reversing, forming a shooting star or pin bar right at resistance. The Heikin Ashi signal was misleading because it smoothed over the critical price action rejection at the resistance level.
Scenario 3: Stop-Loss Placement Issues
You are in an uptrend, and your Heikin Ashi chart shows a series of green candles with no lower wicks. You place your stop-loss just below the low of the most recent Heikin Ashi candle. On the traditional chart, however, the price experienced a quick dip below that Heikin Ashi low (a “stop run” or temporary volatility spike) before the actual candle closed significantly higher. Your stop-loss, placed based on the smoothed Heikin Ashi low, gets hit, while the price on the traditional chart never actually closed below the more logical support level, and the trend continued. You were stopped out unnecessarily due to the imprecision of the Heikin Ashi low as a stop reference point compared to actual price lows or closes.
These scenarios highlight why relying solely on Heikin Ashi’s visual smoothness, without cross-referencing against actual price data, can lead to poor trading decisions and preventable losses.
Navigating the Trade-offs: When Might Heikin Ashi Still Be Useful?
Despite its disadvantages, we don’t want to paint Heikin Ashi as entirely useless. Understanding its strengths allows us to use it appropriately, always remembering its limitations. Heikin Ashi excels at:
- Visualizing Trends: This is its primary strength. It makes the direction and momentum of a trend much clearer, making it easier for traders, especially beginners, to *see* if the market is generally going up or down.
- Filtering Noise: It removes the small, choppy movements that can be distracting on traditional charts, helping traders stay focused on the larger directional move.
- Identifying Trend Pauses/Reversals (with caution): A change in Heikin Ashi candle color, or the appearance of wicks against the trend, can signal a potential pause or reversal in the smoothed trend. However, as discussed, these need confirmation.
So, how can you integrate it responsibly? Use it as a higher-level filter. Look at the Heikin Ashi chart first to get a general sense of the trend on your desired timeframe. If Heikin Ashi shows a strong uptrend (long green candles, no lower wicks), you might then look for long opportunities on the traditional chart. If Heikin Ashi shows a weakening trend (smaller bodies, increasing wicks against the trend), you might be more cautious about taking new positions in the trend direction and look for potential reversal signals on the traditional chart.
It’s about using Heikin Ashi to inform your *bias* or overall market view for a period, but executing your trades and managing your risk based on the precise, actual data provided by traditional charts and other confirmed indicators.
The Sage’s Advice: Mastering Your Tools
Our mission is to empower you with knowledge, helping you understand the tools of the financial markets so you can navigate them wisely. Heikin Ashi is a fascinating invention that offers a unique perspective on price data by averaging it. However, it’s crucial to remember that this averaging process comes with significant trade-offs.
You wouldn’t use a blurred map to navigate a minefield, nor should you rely solely on a smoothed-out price chart when precision and real-time data are critical for your trading strategy and risk management. The disadvantages of Heikin Ashi – its lack of true price representation, inherent lag, poor suitability for short-term trading, and tendency to hide vital information like gaps and precise support/resistance levels – are not minor inconveniences; they are fundamental limitations that can have serious consequences if misunderstood or ignored.
Mastering technical analysis is not just about knowing many indicators or chart types; it’s about understanding what each tool does, how it works (including its calculation), what its strengths and weaknesses are, and how it interacts with other tools and, most importantly, with actual market behavior. Heikin Ashi is a tool for smoothing and visualizing trends, not for precise price analysis, real-time reaction, or identifying specific historical price levels.
If you are actively trading, especially in markets like Forex or with products like CFDs where leverage amplifies the need for precision, understanding the difference between averaged data and actual traded prices is non-negotiable. Choosing a trading platform that provides reliable, real-time data and allows you to easily switch between different charting types and overlay multiple indicators is equally important. For instance, if you’re searching for a broker with regulatory oversight and global trading capabilities, Moneta Markets holds multi-country regulatory certifications including FSCA, ASIC, and FSA. They also offer segregated client funds, free VPS, and 24/7 support, providing a comprehensive package often sought by serious traders who understand the need for robust tools and infrastructure.
Arm yourself with the full picture. Use Heikin Ashi to confirm your trend bias, but execute and manage your trades using the detailed, precise information provided by traditional candlesticks, volume data, and confirmed technical indicators. By doing so, you leverage Heikin Ashi’s strengths while mitigating its significant disadvantages, moving closer to making consistently informed and profitable trading decisions.
heiken ashi disadvantagesFAQ
Q:What are the main disadvantages of Heikin Ashi charts?
A:Heikin Ashi charts can obscure actual price levels, create lagging signals, and may lead to complications in fast-paced trading strategies.
Q:How do Heikin Ashi charts differ from traditional candlestick charts?
A:Heikin Ashi charts are based on averaged price values rather than actual prices, which can distort market interpretation.
Q:Can Heikin Ashi charts be used effectively for trading?
A:They can be useful as part of a broader analysis strategy but should not be relied upon exclusively for precise decision-making.
