
Introduction: Setting the Stage for the September CPI Forecast

Every month, financial markets and policymakers turn their attention to one key report: the Consumer Price Index. As a cornerstone of economic measurement, the CPI offers a detailed window into inflation trends, revealing how quickly prices are rising across a broad spectrum of goods and services. The upcoming September CPI data is especially significant—not only does it capture price movements during a seasonally active period, but it also arrives at a critical juncture in the Federal Reserve’s ongoing battle to stabilize inflation. With interest rates still elevated and economic momentum showing signs of cooling, this report could influence everything from monetary policy to consumer confidence and investment strategies. In this analysis, we unpack the forces shaping the September CPI, examine the latest forecasting methods, and explore what the numbers might mean for the economy in the months ahead.
Understanding the Consumer Price Index (CPI): Basics and Beyond
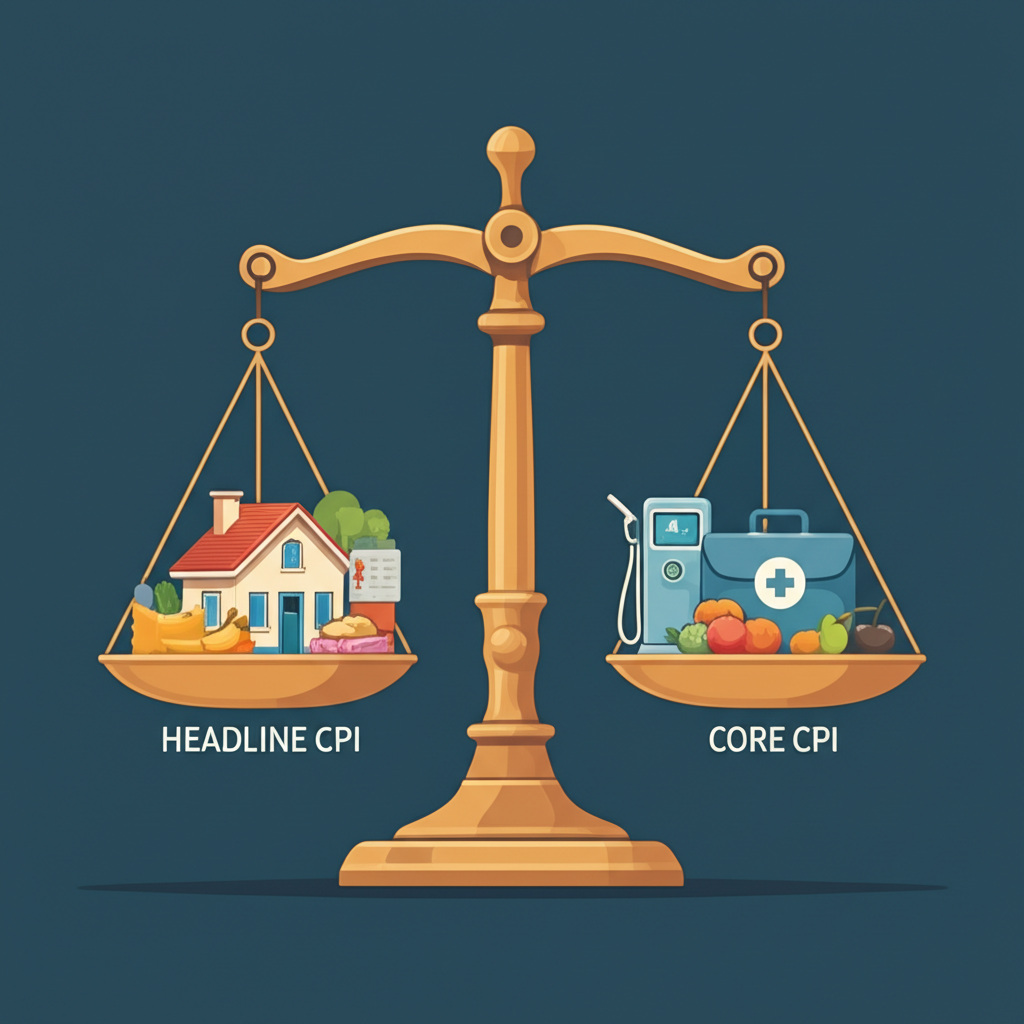
At its core, the Consumer Price Index tracks how much urban consumers pay for a representative basket of goods and services over time. It’s the most widely cited gauge of inflation in the U.S. economy, influencing everything from wage negotiations to Social Security adjustments. Two primary versions of the CPI are closely monitored: **headline CPI**, which reflects the total change in prices across all categories, and **core CPI**, which strips out food and energy to focus on more stable, underlying trends. This distinction matters because food and energy prices can swing sharply due to seasonal or geopolitical factors, potentially distorting the bigger picture. By isolating these volatile components, core CPI often provides a clearer signal of persistent inflationary pressures.
The structure of the CPI basket is weighted based on consumer spending patterns, with housing—particularly rent and owners’ equivalent rent—accounting for nearly one-third of the total. Other major categories include transportation, food, medical care, and apparel. Each category responds differently to economic conditions, and their relative movements help analysts pinpoint where inflation is accelerating or easing. For those seeking detailed methodology or historical context, the U.S. Bureau of Labor Statistics (BLS) publishes comprehensive documentation, including updated weights and regional breakdowns.
Key Factors Influencing the September CPI Outlook

Forecasting the September CPI isn’t just about crunching numbers—it requires understanding the complex web of global and domestic forces that drive price changes. From energy markets to housing dynamics and labor trends, multiple variables converge to shape the inflation landscape. The final reading will hinge on how these factors have evolved over the past month, particularly in areas with the most influence on the overall index.
Energy Prices: Global Supply, Demand, and Geopolitical Dynamics
Energy remains one of the most unpredictable drivers of headline inflation. Crude oil prices, which influence gasoline, heating oil, and transportation costs, are sensitive to shifts in global supply and demand. Over the summer, oil markets fluctuated amid OPEC+ production decisions, ongoing tensions in the Middle East, and changing economic outlooks in major economies like China and the U.S. Even small disruptions—such as pipeline outages or refinery maintenance—can ripple through consumer prices. Additionally, as the northern hemisphere transitions into fall, demand for heating fuels begins to rise, potentially pushing utility costs upward. These seasonal patterns, combined with geopolitical uncertainty, make energy a wild card in the September CPI equation.
Housing Costs: Shelter Inflation’s Persistent Impact
Shelter is the single largest component of the CPI, making it a dominant force in inflation readings. Rent and owners’ equivalent rent (OER) together account for about 32% of the index, and their movements carry outsized weight. However, there’s a notable lag in how housing data flows into the CPI—current figures often reflect lease agreements signed six to twelve months earlier. This means that even if rent growth has slowed in recent months, the full effect may not yet be visible in official statistics. With rental markets only now showing signs of stabilization after years of rapid increases, shelter inflation is expected to remain elevated in the September report, acting as a structural anchor on disinflation efforts.
Food Prices: Supply Chain Resilience, Weather Patterns, and Consumer Demand
Food prices continue to be shaped by a mix of agricultural conditions, global trade flows, and domestic consumption habits. While supermarket inflation has cooled compared to 2022 and 2023, certain categories—like dairy, eggs, and fresh produce—have seen renewed volatility due to extreme weather events and disease outbreaks in livestock. Droughts in key farming regions and flooding in others have disrupted supply chains, affecting everything from grain yields to transportation logistics. At the same time, consumers are spending more on dining out, which feeds into the food-away-from-home index. This shift reflects stronger service-sector demand and wage gains, both of which contribute to service-side inflation. Analysts will be watching whether food prices add further pressure to core CPI in September.
Core Inflation Drivers: Services and Goods Ex-Food and Energy
Beyond food and energy, inflation in services and goods reveals deeper economic trends. Core goods inflation—covering items like furniture, clothing, and electronics—has largely trended downward as supply chains normalized and demand for durable goods cooled post-pandemic. However, core services inflation remains stubbornly high. This includes sectors like healthcare, insurance, recreation, and personal services, where prices are closely tied to labor costs. With unemployment still near historic lows and wage growth running above pre-pandemic levels, businesses face ongoing pressure to raise prices to cover higher salaries. This wage-price dynamic is a key concern for the Federal Reserve, as it suggests inflation may be becoming embedded in the economy’s structure.
Labor Market Conditions and Wage Growth
The strength of the labor market continues to influence inflation expectations. Despite higher interest rates, job growth has remained resilient, with unemployment hovering around 4%. Average hourly earnings have grown at a rate of roughly 4% year-over-year—a pace that, while moderating, still exceeds the Fed’s target for sustainable inflation. When workers earn more, they tend to spend more, supporting demand across the economy. But if wage increases outpace productivity gains, companies may pass those higher costs onto consumers. This feedback loop is central to the Fed’s assessment of whether inflation is truly cooling or merely pausing. Any surprise in the September employment or wage data could therefore alter the trajectory of inflation forecasts.
The Federal Reserve’s Stance and Monetary Policy Implications
For the Federal Reserve, the September CPI report is more than just a data point—it’s a critical input in the decision-making process. The central bank’s dual mandate of price stability and maximum employment puts CPI at the heart of its policy calculus. Recent statements from Fed officials suggest a cautious approach: while inflation has made progress toward the 2% target, it remains above that level, particularly in services. If the September CPI shows a rebound in core inflation, especially in shelter or services, the Fed may feel compelled to hold rates steady or even consider another rate hike. Conversely, a clear deceleration could open the door to a policy pivot, particularly if other indicators like retail sales or manufacturing activity also show cooling. The timing of the report—just weeks before the next FOMC meeting—adds to its significance. Market participants will scrutinize every line of the release for clues about the future path of interest rates, making this one of the most anticipated economic events of the quarter. For official updates on monetary policy direction, the Federal Reserve’s policy page remains the definitive source.
Economists’ Consensus: What the Experts are Forecasting for September
As the release date approaches, economists from major institutions—including Wall Street banks, research firms, and international organizations—publish their projections for the September CPI. While individual estimates vary, a consensus typically emerges in the days leading up to the report. Current forecasts suggest a modest month-over-month increase of around 0.3% for headline CPI, translating to a year-over-year rate of approximately 3.0%. Core CPI is expected to rise slightly less, perhaps 0.2% monthly, with an annual rate near 3.5%. These numbers reflect expectations of continued disinflation, but not a rapid drop. Disagreements among forecasters often stem from differing views on the persistence of shelter inflation, the reliability of real-time data, or the potential for surprise shocks in energy or food markets. Still, the consensus serves as a benchmark that markets use to gauge whether inflation is on track—or veering off course.
Beyond Traditional Forecasts: Leveraging Nowcasting and Real-Time Economic Indicators
In recent years, economists have moved beyond traditional models that rely solely on historical data and lagged indicators. A growing number now use **nowcasting**—a method that combines high-frequency data with statistical models to estimate current economic conditions in real time. One of the most respected tools is the Cleveland Fed’s Inflation Nowcasting model, which updates daily using inputs like gasoline prices, freight costs, and consumer spending trends. These models can detect shifts in inflation before official data confirms them, offering a strategic edge to policymakers and investors.
Nowcasting draws from diverse data sources: credit card transaction data reveals how much people are spending on dining, travel, and retail; satellite imagery tracks shipping activity and crop health; and real-time commodity indices monitor fluctuations in natural gas, electricity, and agricultural futures. Together, these signals paint a more dynamic picture of inflation than monthly surveys alone. However, nowcasting isn’t foolproof—real-time data can be noisy or revised later, and models may struggle during periods of structural change, such as a sudden supply shock or policy shift. Still, when combined with traditional analysis and an understanding of fiscal developments—like recent infrastructure spending or energy subsidies—nowcasting enhances our ability to anticipate the September CPI with greater confidence.
Market Reactions and Broader Economic Outlook Post-September CPI
When the September CPI report drops, financial markets will react swiftly. A higher-than-expected reading, particularly in core inflation, could reignite fears of prolonged high interest rates. Stocks—especially rate-sensitive sectors like technology and real estate—may decline as investors reassess future earnings under tighter monetary conditions. Bond yields would likely climb, reflecting higher inflation risk premiums, while the U.S. dollar could strengthen on expectations of sustained rate differentials with other economies. Conversely, a softer print could spark a rally across risk assets, with equities rising and Treasury yields falling as traders price in earlier rate cuts. The 10-year yield, in particular, is highly sensitive to inflation surprises.
Beyond financial markets, the report will shape business and consumer behavior. Persistent inflation erodes disposable income, forcing households to cut back on non-essential spending. For businesses, rising input costs—whether from wages, energy, or materials—can squeeze margins and delay expansion plans. Over time, this can dampen investment and hiring, slowing overall economic growth. On the other hand, a convincing move toward price stability could restore confidence, encouraging longer-term planning and spending. The September CPI, therefore, does more than measure past price changes—it helps determine the path of future economic momentum.
Conclusion: The Road Ahead for Inflation
The September CPI forecast reflects a pivotal moment in the economic cycle. After years of volatility driven by pandemic disruptions, supply shocks, and aggressive monetary tightening, the economy now stands at a crossroads. Will inflation continue its gradual retreat toward target, or will stubborn pressures in housing, services, and wages keep it elevated? The answer lies in the details of the upcoming report. As analysts parse the numbers, they’ll look beyond headline figures to understand the depth and breadth of price trends. Energy fluctuations may dominate short-term moves, but the real story will be in core services and labor market dynamics. With the Federal Reserve watching closely, and markets poised for reaction, the September CPI will do more than update a statistic—it will shape the narrative of where the economy is headed. By integrating traditional analysis with real-time nowcasting and a nuanced view of fiscal influences, we gain a clearer lens on inflation’s trajectory. For policymakers, investors, and everyday Americans, staying informed isn’t just useful—it’s essential.
What is the current CPI prediction for September?
Specific September CPI predictions vary among economists and are often updated closer to the release date. Generally, analysts will provide a consensus range for both headline (all items) and core (excluding food and energy) CPI, often expressed as a month-over-month or year-over-year percentage change. These forecasts are based on current economic data, commodity prices, and other leading indicators.
How accurate are September CPI forecasts typically?
The accuracy of CPI forecasts can vary significantly. While economists use sophisticated models and real-time data, unexpected global events, sudden shifts in supply chains, or unforeseen changes in consumer behavior can lead to discrepancies between forecasts and actual outcomes. Forecasts generally provide a reasonable indication but are not infallible.
Will the September CPI report impact the Federal Reserve’s interest rate decisions?
Absolutely. The September CPI report is a primary input for the Federal Reserve’s monetary policy decisions. A higher-than-expected CPI could prompt the Fed to consider further interest rate hikes to curb inflation, while a cooling CPI might give them reason to pause or slow their tightening cycle. The report directly influences their assessment of price stability.
What are the key economic components economists are watching most closely in the September CPI?
Economists typically pay close attention to several key components:
- Shelter costs (rent and OER): Due to their large weight and often sticky nature.
- Energy prices: For their volatility and significant impact on headline CPI.
- Food prices: Influenced by global supply chains and weather.
- Core services ex-shelter: Seen as a good indicator of underlying demand and wage pressures.
How does September’s CPI forecast compare to August’s inflation data and historical trends?
Analysts will compare the September CPI forecast to the previous month’s (August) actual CPI data to identify any accelerations or decelerations in inflation. They also contextualize it against historical trends to determine if current inflation is an anomaly or part of a broader, sustained pattern. This comparison helps in understanding momentum.
What is the difference between headline CPI and core CPI, and why is this distinction important for September’s report?
Headline CPI measures the total inflation for all goods and services, including food and energy. Core CPI excludes these volatile categories. The distinction is crucial because core CPI is often considered a better measure of underlying, persistent inflation, as it’s less affected by temporary price swings in food and energy. For September, observing both will provide a comprehensive view of inflationary pressures.
How will the September CPI forecast potentially affect average consumers’ purchasing power and businesses’ operational costs?
If the September CPI is high, it indicates continued inflation, which erodes consumers’ purchasing power as their money buys less. For businesses, higher CPI typically means increased operational costs for raw materials, energy, and labor, potentially leading to lower profit margins or necessitating price increases for their products and services.
Where can I find the official and most up-to-date September CPI report data?
The official CPI report is released monthly by the U.S. Bureau of Labor Statistics (BLS). Their website is the authoritative source for the most current and historical CPI data. Major financial news outlets and economic data providers also report on the release immediately.
Are there any specific global or domestic economic events that could significantly alter the September CPI forecast before its release?
Yes, many events can alter forecasts. Examples include:
- Sudden geopolitical conflicts impacting oil supply.
- Major natural disasters affecting agricultural output or supply chains.
- Significant shifts in exchange rates impacting import costs.
- Unexpected changes in government fiscal policy (e.g., new subsidies or taxes).
- Surprising labor market reports indicating stronger or weaker wage growth.
What does “inflation nowcasting” mean, and how is it used to predict the September CPI?
Inflation nowcasting is a method that uses high-frequency, real-time economic data to estimate current and near-future inflation before official data is published. For the September CPI, nowcasting models would incorporate daily data points like credit card spending, real-time commodity prices (e.g., gasoline, natural gas), and other quick-to-update indicators to provide a dynamic, often more immediate, prediction than traditional, slower-moving models.