
What Is the Aroon Oscillator? A Complete Guide for Traders
The Aroon Oscillator is a powerful trend-following tool designed to assess the strength of market momentum and detect early signs of trend reversals. By focusing on the timing of price highs and lows, it helps traders determine whether an asset is in a strong uptrend, a downtrend, or trading sideways. This clarity makes it especially useful for refining entry and exit decisions, offering timely signals that align with evolving market conditions.
Introduced in 1995 by renowned technical analyst Tushar Chande, the Aroon system was built to catch trends at their inception. The name “Aroon,” derived from Sanskrit, means “Dawn’s Early Light”—a poetic nod to its ability to illuminate the first signs of a new directional move. While it shares roots with the Aroon Indicator, the Aroon Oscillator distills that information into a single line, simplifying interpretation and making it more accessible for active traders.
Unlike indicators that measure price velocity or momentum intensity, the Aroon Oscillator zeroes in on time-based patterns. It answers a critical question: *How recently has this asset hit a new high or low?* This unique perspective allows it to spotlight emerging trends before they fully mature, giving traders a strategic edge.
Breaking Down the Aroon System: Up and Down Lines
To fully grasp how the Aroon Oscillator works, it’s essential to understand its foundational components: Aroon Up and Aroon Down. These two metrics form the backbone of the original Aroon Indicator and are critical in generating the oscillator’s signals. Their interplay reveals whether bullish or bearish forces are gaining traction.
Both values are calculated over a defined look-back period, most commonly set to 25 periods. However, many traders adjust this to 14 for increased sensitivity on shorter timeframes. This window determines how far back the indicator looks when identifying the most recent price extremes.
Aroon Up: Tracking Bullish Strength
Aroon Up evaluates the strength of upward momentum by measuring how long it has been since the asset reached a new high within the selected period. The shorter the time since the peak, the stronger the bullish signal. A reading near 100 indicates a fresh high—typically a sign of robust buying pressure. On the other hand, a low Aroon Up value suggests weakening momentum, as it has been some time since buyers pushed prices to new highs.
Aroon Down: Gauging Bearish Momentum
Conversely, Aroon Down tracks the strength of the downtrend by assessing how recently a new price low occurred. A high Aroon Down value (close to 100) means a new low was recorded recently, pointing to strong selling activity. As this value declines, it signals that downward momentum is fading—potentially setting the stage for a reversal or consolidation phase.
Understanding the Math Behind the Aroon Oscillator
While most trading platforms compute the Aroon Oscillator automatically, knowing the underlying formulas enhances your ability to interpret its behavior and anticipate its signals. The process begins with calculating the two core components, then combines them into a single, actionable line.
Calculating Aroon Up
The formula for Aroon Up reflects the recency of a price peak. The more recent the high, the higher the value.
Formula: `Aroon Up = [ (Number of Periods) – (Periods Since Highest High) ] / (Number of Periods) × 100`
Example: Using a 25-day period, if the highest price occurred just 3 days ago, the calculation would be:
`[25 – 3] / 25 × 100 = 88`. A value of 88 signals strong and recent bullish momentum.
Calculating Aroon Down
The Aroon Down formula mirrors the above but focuses on the lowest price point during the look-back window.
Formula: `Aroon Down = [ (Number of Periods) – (Periods Since Lowest Low) ] / (Number of Periods) × 100`
Example: In the same 25-day period, if the lowest price was seen 18 days ago:
`[25 – 18] / 25 × 100 = 28`. This suggests bearish momentum is present but not dominant.
Deriving the Aroon Oscillator
The Aroon Oscillator is derived by subtracting Aroon Down from Aroon Up. The result is a single line that oscillates between -100 and +100, offering a clear visual representation of trend dominance.
Formula: `Aroon Oscillator = Aroon Up – Aroon Down`
Example: Using the values above:
`88 (Aroon Up) – 28 (Aroon Down) = +60`. A reading of +60 indicates a strong uptrend with bullish momentum firmly in control.
Interpreting the Aroon Oscillator: Signals That Work
The real power of the Aroon Oscillator lies in its simplicity and clarity. Its position relative to the zero line and movement toward the extremes provide actionable insights into trend direction and strength. According to authoritative sources on technical analysis, the most reliable signals come from zero-line crossovers and sustained readings in overbought or oversold zones.
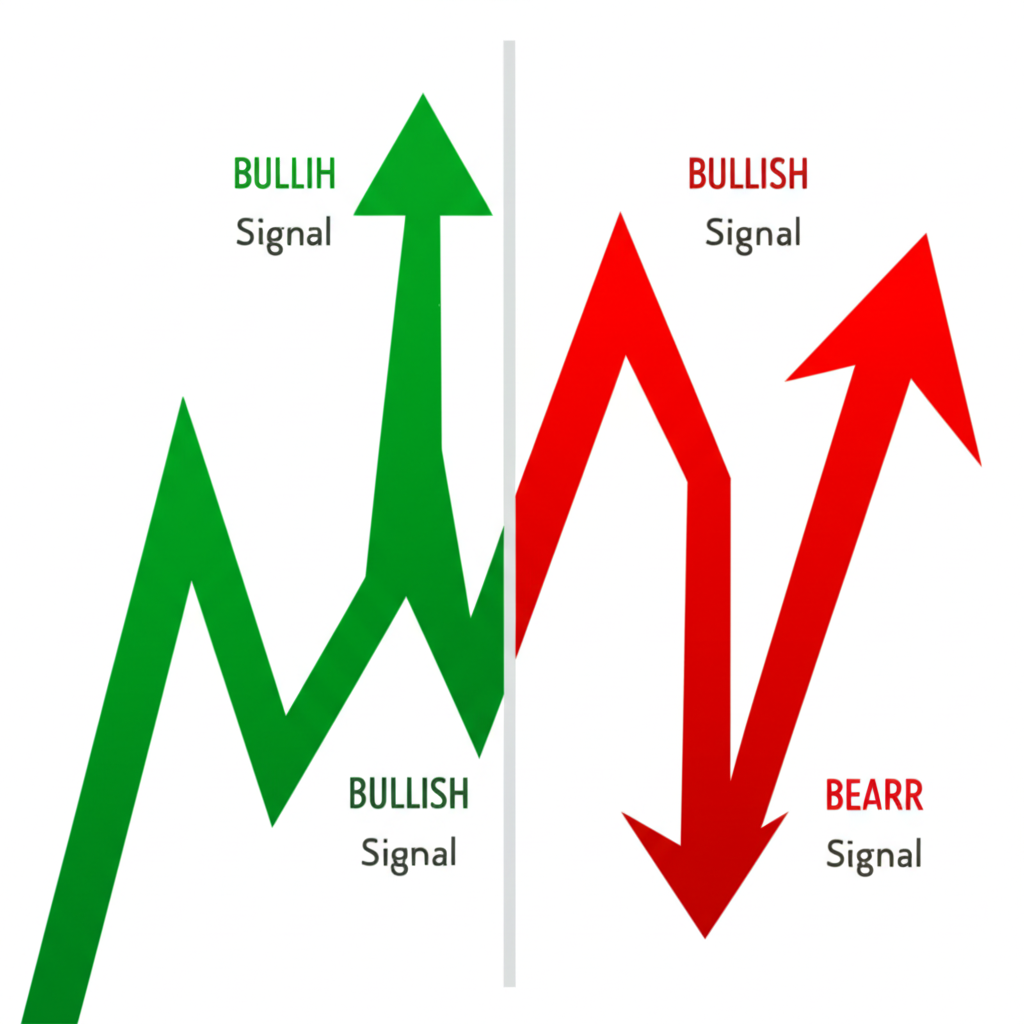
- Positive Readings (Above 0): When the oscillator is above zero, Aroon Up exceeds Aroon Down—bullish momentum is in charge. The closer the value gets to +100, the stronger and more sustainable the uptrend.
- Negative Readings (Below 0): A reading below zero means Aroon Down is dominant, signaling bearish control. As it approaches -100, the downtrend gains conviction.
- Zero-Line Crossover: This is the oscillator’s most significant signal. A move from negative to positive territory often marks the start of a new uptrend and serves as a potential buy signal. Conversely, a drop from positive to negative may indicate the beginning of a downtrend and a sell opportunity.
- Extreme Levels (+100 and -100): A +100 reading means a new high was recorded in the most recent period—the strongest possible bullish confirmation. A -100 reading signifies a fresh low, representing peak bearish strength.
| Signal Type | Oscillator Reading | Interpretation |
|---|---|---|
| Potential Buy Signal | Crosses above 0 | Bullish momentum is taking control; a new uptrend may be starting. |
| Potential Sell Signal | Crosses below 0 | Bearish momentum is taking control; a new downtrend may be starting. |
| Strong Uptrend | Consistently above +50 | The uptrend is established and strong. |
| Strong Downtrend | Consistently below -50 | The downtrend is established and strong. |
| Ranging / Consolidation | Hovers around the 0 line | No clear trend is present; the market is indecisive. |
3 Proven Trading Strategies Using the Aroon Oscillator
Putting theory into practice is where the Aroon Oscillator proves its worth. Below are three practical, rule-based strategies that leverage its strengths—each designed to improve trade timing, reduce false signals, and enhance overall performance.
Strategy 1: Capturing New Trends with Zero-Line Crossovers
This foundational strategy uses zero-line crossovers as the primary trigger for entering new positions. It’s ideal for trend-following traders looking to ride momentum from the early stages.
- Buy Signal: The Aroon Oscillator crosses above zero, indicating that bullish strength has overtaken bearish pressure.
- Entry Rule: Enter a long position at the open of the candle immediately following the crossover. This slight delay adds confirmation and reduces the risk of acting on a false breakout.
- Sell Signal: The oscillator crosses below zero, signaling a shift in momentum toward the bears.
- Entry Rule: Initiate a short position at the open of the next candle after the bearish crossover confirms.
- Exit Rule: Exit can be triggered by an opposite crossover, or via a trailing stop-loss to protect gains as the trend evolves. Traders using Moneta Markets’ advanced charting suite can automate these exits with precision.
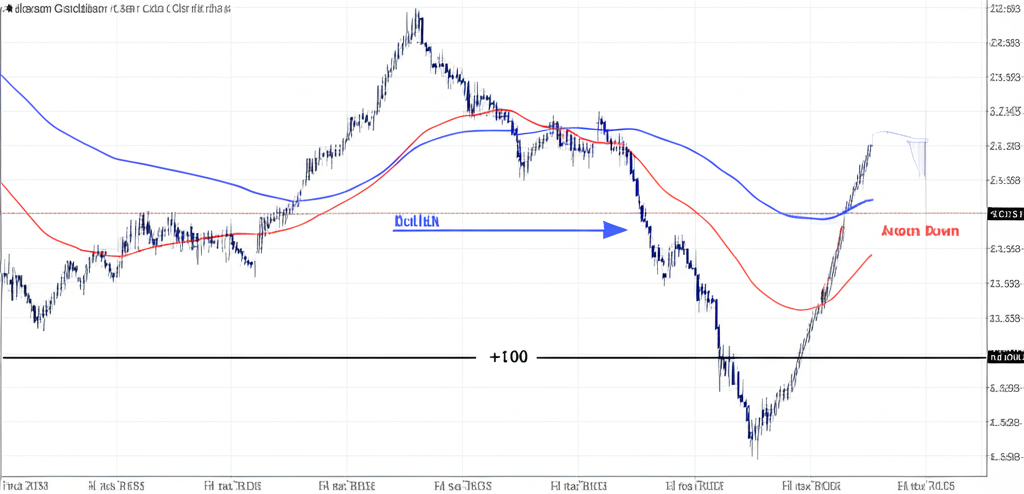
(On a chart, this would appear as the oscillator line breaking the zero level, followed by a price move in the corresponding direction. The entry is marked on the next candlestick.)
Strategy 2: Spotting Sideways Markets and Avoiding Whipsaws
One of the most overlooked aspects of successful trading is knowing when to stay out of the market. The Aroon Oscillator excels at identifying consolidation phases, helping traders avoid costly false signals during choppy conditions.
- Consolidation Signal: The oscillator fluctuates narrowly around the zero line without making a decisive move in either direction.
- Confirmation: If you also plot the Aroon Indicator, both Aroon Up and Aroon Down will trend downward together—indicating neither new highs nor lows are being formed.
- Action: Treat this as a caution zone. Close trend-following positions or refrain from entering new ones. Wait for a strong breakout where the oscillator moves decisively above +50 or below -50 before re-engaging. Platforms like Moneta Markets offer volatility filters that can be paired with Aroon to further refine timing.
(A chart example would show a flat price range with the Aroon Oscillator oscillating tightly around zero—clearly highlighting the lack of directional momentum.)
Strategy 3: Combining Aroon with Moving Averages for Higher-Probability Setups
To boost signal reliability, many professional traders layer the Aroon Oscillator with a trend filter such as the 50-period or 200-period Exponential Moving Average (EMA). This combination helps distinguish between genuine trend initiations and countertrend noise.
- The Filter: The EMA defines the broader trend. Price above the EMA suggests bullish bias; below indicates bearish dominance.
- Filtered Buy Signal: Only act on a bullish Aroon crossover (above zero) when price is also trading above the 50 EMA. This ensures alignment with the larger trend.
- Filtered Sell Signal: Take bearish crossovers seriously only when price is below the 50 EMA. This avoids premature entries against the dominant trend.
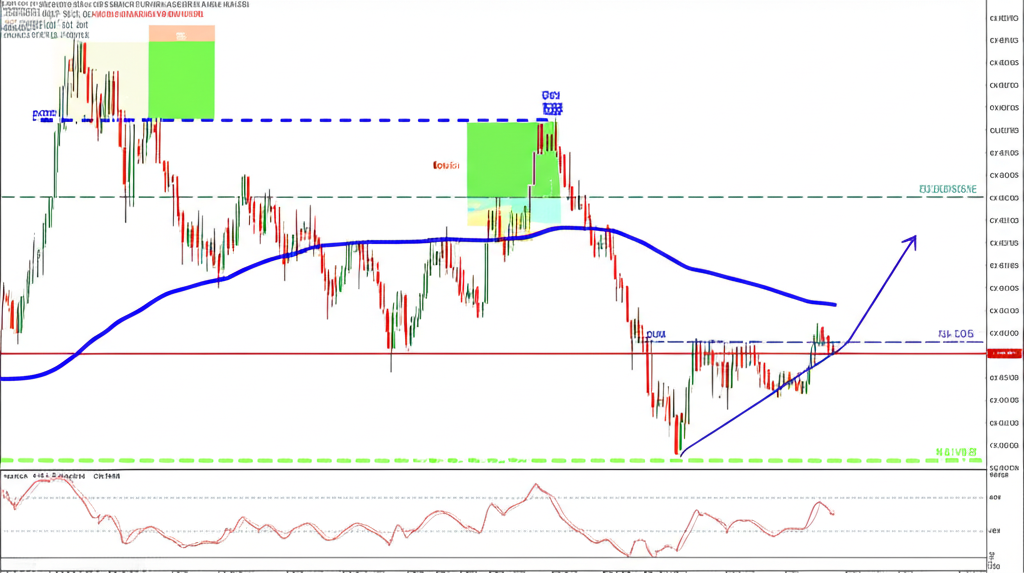
(A sample chart would display price, the 50 EMA, and the Aroon Oscillator—highlighting valid signals that occur in the direction of the trend, while filtering out those that don’t.)
Common Challenges and Limitations to Watch For
No indicator is perfect, and the Aroon Oscillator comes with trade-offs. Recognizing its limitations allows traders to use it more effectively and protect capital during unfavorable conditions.
- It’s a Lagging Indicator: Because it relies on past price data—specifically the timing of recent highs and lows—the Aroon Oscillator confirms trends after they’ve begun. This means traders might miss the initial leg of a strong move. Exit signals can also lag, potentially resulting in reduced profits if a reversal happens suddenly.
- Prone to Whipsaws in Choppy Markets: In sideways or volatile markets, the oscillator frequently crosses the zero line, generating false signals. These “whipsaws” can lead to repeated small losses. The best defense is to first confirm the market isn’t in consolidation mode—Strategy #2 is invaluable here.
Aroon Oscillator vs. RSI and MACD: Understanding the Difference
Traders often compare the Aroon Oscillator to other popular momentum tools like the Relative Strength Index (RSI) and the Moving Average Convergence Divergence (MACD). While all three assess market momentum, their methodologies differ significantly.
The key difference is what they measure. The Aroon Oscillator focuses on time—specifically, how long it has been since the last high or low. This gives it a unique ability to detect the “freshness” of a trend. In contrast, RSI measures the magnitude of recent price changes, comparing gains to losses over a set period. MACD, meanwhile, evaluates the relationship between two moving averages to identify momentum shifts. Because Aroon doesn’t rely on price velocity, it offers a complementary perspective that can uncover trends before other indicators catch on.
What is the best setting for the Aroon Oscillator?
The default setting is a 25-period look-back, which works well for swing traders. However, active day traders often prefer a 14-period setting for quicker responses to price action. The optimal setting depends on your trading style, timeframe, and market conditions. It’s advisable to test different configurations using historical data to find the best fit for your strategy.
How do you get a buy signal from the Aroon indicator?
A key buy signal occurs when the Aroon Oscillator crosses from below zero to above zero, indicating that bullish momentum is overtaking bearish pressure. Alternatively, on the two-line Aroon Indicator, a buy signal appears when Aroon Up crosses above Aroon Down. For higher-confidence entries, traders often wait for the oscillator to rise above zero while price is also trading above a major moving average, such as the 50 EMA.
Is the Aroon Oscillator a leading or lagging indicator?
The Aroon Oscillator is considered a lagging indicator. It confirms the presence of a trend based on historical price data—specifically the timing of recent highs and lows. As such, its signals follow price movements rather than predict them. While it can spot trend beginnings early, it does so only after the fact.
Can the Aroon Oscillator be used for day trading?
Yes, the Aroon Oscillator can be effectively used in day trading. By applying a shorter look-back period—such as 10 or 14—and using it on 1-minute, 5-minute, or 15-minute charts, traders can detect intraday trend shifts. However, shorter timeframes increase signal frequency and the risk of false readings, so pairing it with volume or volatility filters improves reliability. Platforms like Moneta Markets provide real-time Aroon integration across multiple assets, making it ideal for intraday analysis.
What is the difference between the Aroon Indicator and the Aroon Oscillator?
The main difference is in structure and interpretation:
- The Aroon Indicator consists of two lines—Aroon Up and Aroon Down. Traders look for crossovers between them to generate signals.
- The Aroon Oscillator is a single line calculated as Aroon Up minus Aroon Down. It simplifies analysis by focusing on zero-line crossovers, making it easier to interpret at a glance.
How can I get the Aroon Oscillator on TradingView for free?
The Aroon Oscillator is freely available on TradingView. Simply click the “Indicators” button on any chart, search for “Aroon,” and select “Aroon Oscillator” from the list. It’s also natively supported on MT4, MT5, and most brokerage platforms, including Moneta Markets, which offers seamless integration across forex, indices, and commodities. You can learn more in platform documentation.
What does it mean when the Aroon Oscillator is at 50?
A reading of +50 on the Aroon Oscillator suggests moderate bullish strength—it means the uptrend is present but not yet powerful. Unlike the two-line Aroon Indicator, where crossing above 50 is a key signal, the oscillator’s critical levels are 0 (for crossovers), +100 (maximum bullish strength), and -100 (maximum bearish strength). A value around +50 simply indicates a developing or stable uptrend.
Which indicators work best in combination with the Aroon Oscillator?
The Aroon Oscillator performs best when paired with non-correlated tools that provide additional context. Recommended combinations include:
- Moving Averages (e.g., 50 or 200 EMA): To confirm the overall trend direction.
- Volume Indicators (e.g., On-Balance Volume): To validate breakouts signaled by Aroon.
- Volatility Indicators (e.g., Average True Range – ATR): To set dynamic stop-loss levels based on current market conditions.
As emphasized by experts at Fidelity’s learning center, combining diverse indicators leads to more robust and reliable trading decisions.