
As you navigate the dynamic world of financial markets, you’ll quickly discover that prices rarely move in a straight line. They surge, they pause, they consolidate, and then they often continue their journey. Understanding these pauses and consolidations is crucial for anticipating future movements. One particularly powerful pattern that signals a likely continuation of an upward trend is the Bullish Pennant pattern.
Think of it like a runner who has just completed a strong sprint. They need a moment to catch their breath, gather their energy, before launching into the next, potentially even faster, leg of the race. In the market, this “breathing” period is represented by the consolidation phase, and the bullish pennant is one specific visual representation of this phenomenon. For both new investors and seasoned traders looking to sharpen their technical analysis skills, recognizing and understanding the implications of this pattern can unlock significant opportunities.
In this comprehensive guide, we will delve deep into the anatomy of the bullish pennant, exploring not just how it looks, but the market psychology that drives its formation. We’ll discuss the vital role of volume, how to use technical indicators for confirmation, and look at recent real-world examples across different asset classes, including cryptocurrencies like Ethereum, Mantle, and Binance Coin, as well as the often-unpredictable Gold market. We’ll also equip you with practical strategies for trading the pattern and, critically, how to manage the inherent risks involved.
Key aspects to remember about the bullish pennant include:
- It signals a potential continuation of a bullish trend.
- It typically forms over a short period within a larger uptrend.
- Volume analysis is crucial for confirming valid breakouts.
| Pattern Component | Description |
|---|---|
| Flagpole | Initial strong price movement indicating significant buying pressure. |
| Pennant | A symmetrical triangle formed during consolidation phase with converging trendlines. |
| Breakout | Price moves above the upper trendline with increased volume, indicating continuation of the trend. |
To effectively identify a bullish pennant, you need to understand its core components. It’s a relatively short-term pattern, typically forming over one to three weeks, and it appears within a larger, established uptrend. The pattern itself consists of three key parts:
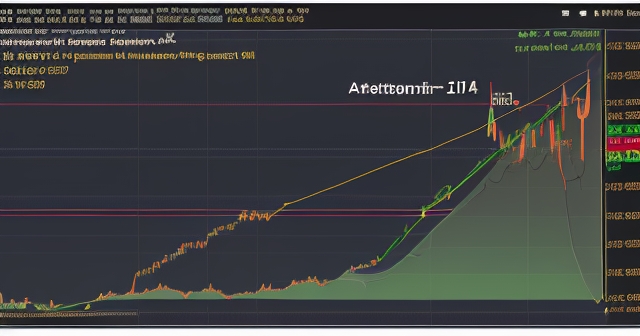
- The Flagpole: This is the initial, strong, almost vertical price movement that precedes the consolidation. It represents a rapid surge in buying pressure, driving the price significantly higher in a short period. The length of the flagpole is important, as it often provides a potential price target once the pattern resolves. A long, strong flagpole indicates significant initial momentum, which the pattern suggests is likely to resume.
- The Pennant: Following the flagpole, the price enters a period of consolidation. This is where buyers and sellers are temporarily in balance. The price action during this phase forms a small, symmetrical triangle. This is created by drawing two converging trendlines: one connecting a series of lower highs and another connecting a series of higher lows. The consolidation is tight and compact, resembling a small pennant flag. Unlike flags (which have parallel trendlines), pennants have converging lines.
- The Breakout: This is the decisive moment. After the consolidation phase, buying pressure eventually overwhelms selling pressure, and the price breaks convincingly above the upper trendline of the pennant formation. A valid breakout is typically accompanied by a significant surge in trading volume, confirming renewed buying interest and the likely continuation of the preceding uptrend.
The symmetry of the pennant suggests indecision during the consolidation, but the preceding flagpole provides the bullish context. The market pauses, traders take profits or new traders initiate positions, leading to the contracting range. However, the underlying strength of the initial move (the flagpole) suggests that the bulls are merely resting before pushing the price higher. Your goal as a trader is to identify this resting phase and position yourself for the impending breakout.
Understanding the psychology behind chart patterns adds a deeper layer to your analysis, moving beyond just recognizing shapes on a chart. The bullish pennant is a fascinating study in market sentiment and participant behavior. Let’s break down the psychological elements at play:
- The Flagpole: This sharp upward move is driven by strong conviction among early buyers. News, fundamental analysis, or simply accumulating momentum attracts a wave of buying, leading to a rapid price increase. This phase is characterized by excitement and FOMO (Fear Of Missing Out) among those not yet in the trade.
- The Pennant Consolidation: After the rapid ascent, a few things happen. Initial buyers who rode the flagpole see substantial profits and begin to sell, locking in gains. This selling pressure is met by new buyers who believe the trend will continue and see the slight pullback or sideways movement as an opportunity to enter at a better price. The balance between these two forces – profit-taking sellers and new buyers – creates the tightening price range and decreasing volatility characteristic of the symmetrical triangle pennant. It’s a period of temporary equilibrium, where the market seems to be deciding its next move, but within the bullish context established by the flagpole.
- The Breakout: This occurs when the influx of new buyers, perhaps combined with the exhaustion of profit-taking sellers, finally tips the scale decisively towards the bulls. As the price pushes above the upper trendline, it triggers buy stops placed by traders waiting for confirmation and attracts a fresh wave of momentum buyers. This cascade of buying activity fuels the upward breakout, often with increased velocity, resuming the prior uptrend.
Essentially, the bullish pennant is a brief intermission where the market digests a significant move. It’s a test of the trend’s strength. If the consolidation is healthy (tight range, low volume), it suggests that sellers are not aggressively pushing the price down, and buyers are waiting in the wings. A successful breakout confirms that the underlying bullish momentum remains intact and is ready to propel the price higher.
While the visual shape of the pennant is the primary identifier, volume analysis is absolutely critical for validating the pattern’s potential. A bullish pennant without the correct volume profile is far less reliable and increases the risk of a false breakout.
Here’s the typical volume signature you want to see:
- Flagpole: High and often increasing volume accompanies the strong initial price surge. This confirms the strength and conviction behind the initial move.
- Pennant Consolidation: Volume should noticeably decrease and remain low during the formation of the symmetrical triangle. This indicates that neither buyers nor sellers have strong conviction during this pause. It suggests supply and demand are relatively balanced, and the major participants are waiting on the sidelines. Low volume during consolidation is a healthy sign for a continuation pattern.
- Breakout: A valid upward breakout from the pennant *must* be accompanied by a significant spike in volume. This surge confirms that strong buying pressure has returned and is driving the price higher. A breakout on low volume is suspicious and has a higher probability of being a false signal.
| Volume Stage | Characteristics |
|---|---|
| Flagpole | High, increasing volume accompanying price surge. |
| Pennant Consolidation | Low, stable volume, indicating equilibrium between buyers and sellers. |
| Breakout | Significant increase in volume confirming renewed buying interest. |
Beyond volume, integrating other technical indicators can significantly enhance the probability of a successful trade setup based on a bullish pennant. Think of these indicators as additional witnesses confirming the story the price action and volume are telling you.
- Relative Strength Index (RSI): During the pennant consolidation, the RSI might cool off from overbought levels reached during the flagpole. A bullish signal is reinforced if, upon breakout, the RSI turns upwards and moves strongly above 50, or even better, towards overbought territory, confirming increasing momentum.
- Moving Average Convergence Divergence (MACD): Look for the MACD lines to converge or flatten during the pennant. A bullish crossover (MACD line crossing above the signal line) at or around the time of the price breakout provides strong confirmation of renewed bullish momentum.
- Bollinger Bands: The Bollinger Bands typically contract significantly during the low-volatility consolidation phase of the pennant. The breakout is often signaled by the price pushing outside the upper Bollinger Band, accompanied by an expansion in the bands (indicating increasing volatility and momentum). Some analysts, like those observing Mantle ($MNT), specifically look for Bollinger Bandwidth (BBW) to bottom out, suggesting a volatility contraction is ending and a large move is imminent.
- Support and Resistance: Key horizontal support and resistance levels should be considered. The upper trendline of the pennant acts as diagonal resistance. A breakout above this trendline is more significant if it also breaks above a nearby horizontal resistance level. Conversely, the lower trendline acts as diagonal support during consolidation.
- Multiple Timeframes: Always look at the pattern on different timeframes. A pennant visible on a 1-hour chart within a strong uptrend on the daily chart is a more powerful signal than a pennant on a 5-minute chart in a sideways daily trend. Confirming the overall trend context is vital.
Using this combination of pattern recognition, volume analysis, and technical indicator confirmation gives you a much higher probability setup than relying on the pattern alone. It’s about building a confluence of bullish signals.
If you’re exploring trading strategies that involve technical analysis across a range of instruments, including potentially identifying these patterns in Forex pairs or other CFDs, choosing a platform with robust tools and flexible trading options is key. When considering which platform best supports your analytical approach, Moneta Markets is a platform worth exploring. It offers access to over 1000 financial instruments and supports popular platforms like MT4, MT5, and Pro Trader, providing the technical environment many traders need.
Recently, technical analysts have noted the emergence of bullish pennant patterns on the charts of several prominent cryptocurrencies, sparking discussions about potential significant upward moves. Let’s examine some of these observations based on recent market data and analyst commentary.
Ethereum ($ETH)
As a cornerstone of the crypto market, price action on Ethereum’s chart is closely watched. While ETH has experienced volatility, some analysts have pointed to formations resembling bullish pennants within recent uptrends. The implication here is that despite pullbacks or sideways price action, the underlying buying pressure from previous rallies could be consolidating before the next leg up.
Identifying a bullish pennant on ETH would involve spotting a prior strong upward ‘flagpole’ move, followed by a tight, symmetrical consolidation phase with decreasing volume. A confirmed breakout above the upper trendline, ideally on increasing volume, would reinforce the bullish outlook. Analysts observing such patterns might project price targets for ETH by adding the height of the ‘flagpole’ to the breakout point. While specific targets vary based on the timeframe and the exact pattern observed, the presence of this pattern suggests that the market is preparing for potential price continuation, potentially targeting significant resistance levels or even new highs in a broader bullish market context.
Mantle ($MNT)
Mantle, the governance token of the Mantle Network, has also been a subject of bullish pennant analysis. One notable observation, shared by analysts like Trader Tardigrade (@TATrader_Alan), highlighted a potential bullish pennant formation on the $MNT chart, coupled with a bottoming out of Bollinger Bandwidth (BBW). This confluence of signals is significant.
The presence of a clear flagpole followed by a tight pennant suggests a strong preceding trend and a healthy consolidation. The BBW bottoming provides crucial confirmation, indicating that volatility has compressed to low levels, historically preceding significant price movements. For MNT, the identification of this pattern, combined with on-chain data analysis by others potentially showing increasing wallet activity or transaction volume, further strengthened the bullish case. The projected target mentioned based on this pattern was around $0.85, derived using the classic flagpole measurement technique. Such detailed analysis, combining pattern recognition with indicators and even fundamental (on-chain) data, exemplifies a robust approach to trading these patterns.
Binance Coin ($BNB)
BNB, the native coin of the Binance ecosystem, has also shown patterns interpreted as bullish pennants by various market observers, including analysts like Batman and World of Charts. Given BNB’s strong performance and ecosystem growth, a bullish pennant here would suggest that its uptrend is likely to persist after periods of consolidation.
Analysing BNB’s chart for a bullish pennant involves the same principles: a clear flagpole followed by a converging consolidation pennant with volume characteristics. The breakout above the upper trendline would be the trigger. Analyst projections for BNB, based on these patterns and other technical factors, have sometimes been quite ambitious, ranging from $930 to $1000. These targets are typically calculated from the flagpole’s height, added to the breakout point, and often align with significant psychological levels or Fibonacci extensions. The consistent identification of this pattern by multiple analysts across different platforms suggests a noteworthy technical setup for BNB, indicating potential for a substantial price rally if the pattern confirms with a decisive, high-volume breakout.
While bullish pennants are frequently discussed in the volatile crypto markets, they are universal technical patterns that appear across all asset classes, including traditional commodities like Gold. Interestingly, a bullish pennant formation has reportedly been identified on the daily chart for Gold, suggesting potential for further upward movement despite other potentially conflicting signals.
Gold has seen significant price action, driven by various macroeconomic factors. A bullish pennant on its daily chart would paint a picture of a strong initial rally (flagpole), followed by a period of tighter consolidation (pennant) as buyers and sellers debate the next move. The potential breakout from such a pattern would signal that the bullish momentum from the prior rally is set to continue.
| Market | Potential Factors |
|---|---|
| Cryptocurrency | High volatility, rapid price movements, sentiment-driven by news. |
| Gold | Influenced by macroeconomic factors, inflation, and market stability. |
The presence of this pattern on Gold’s chart is particularly noteworthy because some analysts have also identified potentially bearish patterns, such as a Double Top or a Shooting Star candlestick pattern, within the same timeframe or general area. This highlights a critical aspect of technical analysis: patterns can conflict, and the market can present mixed signals. In such a scenario, the confirmation of the bullish pennant becomes paramount. A decisive breakout above the pennant’s upper trendline, especially if it also clears significant horizontal resistance levels that might be associated with the bearish patterns, would suggest that the bulls have won the immediate battle, invalidating the bearish signals and potentially driving Gold prices higher.
For traders interested in diversifying their technical analysis application beyond digital assets, identifying classic patterns like the bullish pennant in traditional markets like Gold demonstrates the universal nature of market psychology and price action principles. Whether you’re looking at Bitcoin, Ethereum, or Gold, the underlying dynamics of trend continuation and consolidation often leave similar footprints on the chart.
When considering how to trade a wide array of assets, from cryptocurrencies to traditional commodities and Forex, selecting a trading platform that offers access to all these markets is a practical step. If you’re exploring options for global trading across diverse asset classes, Moneta Markets offers a broad selection of instruments and multiple regulatory licenses (like FSCA, ASIC, FSA), providing both variety and a degree of regulatory oversight that many traders prioritize.
Once you’ve identified a potential bullish pennant and confirmed it with volume and indicators, the next step is to develop a trading strategy. There are several ways to approach trading this pattern, each with its own risk profile:
- The Conservative Entry (Post-Breakout Confirmation): This is arguably the safest approach. You wait for a clear, convincing breakout above the upper trendline, ideally with a strong increase in volume. Entry is typically placed just above the breakout level. Confirmation might involve waiting for a candle to close above the trendline on your chosen timeframe (e.g., a daily candle closing above the daily pennant trendline).
- The Aggressive Entry (Near Breakout): Some traders might enter slightly before or immediately upon the price touching the upper trendline, anticipating the breakout. This offers a potentially better entry price but carries a higher risk of a false breakout. This strategy requires more vigilance and potentially a tighter stop-loss.
- The Retest Strategy: Often, after a breakout, the price will retrace back to the breakout level (the former resistance trendline) to test it as new support before continuing its move. Waiting for this retest and entering on the bounce off the trendline-turned-support can offer a lower-risk entry with clear validation that the breakout level is holding. This is a patient approach but can reduce the chances of being caught in a false breakout.
Regardless of your entry strategy, proper risk management is non-negotiable. Here’s how you typically manage risk and set targets:
- Stop-Loss Placement: A common and effective place to set your stop-loss is just below the lower trendline of the pennant or below the lowest point within the pennant formation. This point represents the invalidation of the bullish pattern. If the price falls below this level, the bullish setup is likely wrong, and you should exit the trade to limit your losses.
- Price Target Calculation: The most widely used method for setting a price target from a bullish pennant is to measure the height of the flagpole (from the beginning of the move to the start of the pennant consolidation) and add that distance to the breakout point. For example, if the flagpole was $100 high and the breakout occurred at $500, the potential target would be $600. This method assumes the strength of the move post-breakout will be similar to the initial move.
- Risk/Reward Ratio: Before entering any trade, calculate your potential profit (target price minus entry price) versus your potential loss (entry price minus stop-loss price). Aim for trades with a favorable risk/reward ratio, typically 1:2 or higher (meaning you stand to gain at least twice as much as you risk losing).
- Position Sizing: Only risk a small percentage of your total trading capital on any single trade, typically 1-2%. This protects your overall portfolio in case of unexpected moves or false breakouts.
Trading bullish pennants isn’t just about finding the pattern; it’s about executing a disciplined trading plan based on confirmation, clear entry/exit points, and strict risk management. The potential targets derived from the flagpole are projections, not guarantees, and the market can always surprise you.
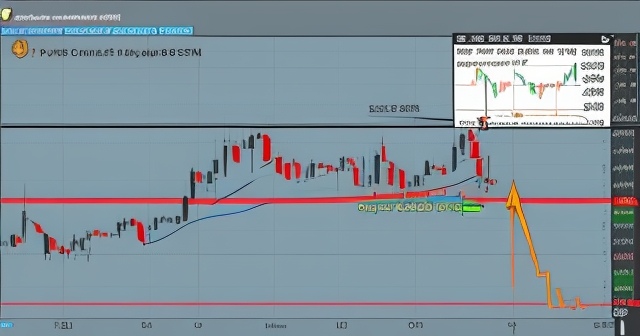
While bullish pennants offer exciting potential, it’s crucial to be aware of the risks involved. No pattern is 100% accurate, and false signals are a reality in trading. The most significant risk when trading a bullish pennant is a false breakout.
A false breakout occurs when the price briefly pushes above the upper trendline of the pennant, perhaps triggering some breakout entries, but then quickly reverses back into the pennant or even breaks below the lower trendline. False breakouts can be particularly damaging because they trap traders who entered on the initial signal and can lead to sharp moves in the opposite direction as those traders are forced to exit their positions.
How can you minimize the risk of false breakouts?
- Confirm with Volume: As discussed, a breakout on low volume is a red flag. Wait for a noticeable spike in volume accompanying the price move.
- Confirm with Candle Close: Don’t just react to a price poke above the trendline. Wait for the candlestick on your chosen timeframe (e.g., 4-hour or daily) to close decisively above the trendline.
- Use Multiple Indicators: Ensure other indicators (RSI, MACD) are confirming the bullish momentum at the time of the breakout.
- Wait for a Retest: The retest strategy mentioned earlier is specifically designed to avoid initial false breakouts by waiting for confirmation that the breakout level is holding as support.
- Consider Market Context: Is the overall market sentiment bullish? Are there major news events imminent? Trading against strong market headwinds or into significant news can increase the likelihood of a false signal.
Other risks include:
- Pattern Failure: Sometimes, the consolidation simply resolves downwards, breaking the lower trendline instead of the upper one. This invalidates the bullish pattern and often leads to a significant price decline. This is why your stop-loss below the lower trendline is essential.
- Target Not Reached: Even with a valid breakout, the price might not reach the full flagpole-measured target. Profit targets are estimates, and market conditions can change, causing the move to fall short. Be prepared to adjust your target or trail your stop-loss as the trade progresses.
- Volatility: While pennants are periods of low volatility, the breakout can be sharp and fast. Ensure your platform can handle rapid price movements and order execution.
Effective risk management isn’t just about setting a stop-loss; it’s about rigorous pattern identification, seeking multiple confirmations, understanding the market context, and only risking a small portion of your capital on any single trade. Treat every pattern as a probability, not a certainty.
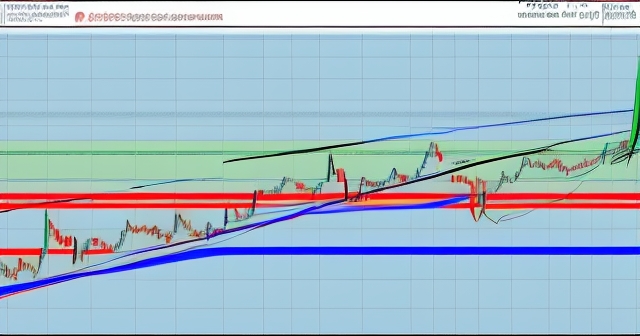
It’s easy to confuse bullish pennants with other similar chart patterns, particularly bullish flags and ascending or falling wedges. While they all suggest potential trend continuation after a pause, their formations and implications have subtle but important differences.
- Bullish Flag: Like the pennant, a bullish flag follows a strong flagpole. However, the consolidation phase forms a parallelogram or rectangle by drawing two parallel trendlines (either horizontal or slightly angled against the trend). The volume profile is similar (high on flagpole, low on flag, high on breakout). The key difference is the parallel nature of the consolidation channel in a flag, versus the converging lines in a pennant.
- Bullish Pennant: As we know, this pattern has converging trendlines during the consolidation phase, forming a symmetrical triangle. It represents a tighter period of indecision compared to a flag’s more defined channel.
- Wedges (Rising/Falling): Wedges are also consolidation patterns with converging trendlines, but unlike pennants (which are typically short-term continuations of strong moves), wedges can sometimes signal trend reversals, especially when they form over longer periods or their slope is against the prevailing trend. A Rising Wedge in an uptrend is often considered bearish, while a Falling Wedge in a downtrend is considered bullish (a reversal pattern). The lines in a wedge are also typically more angled. A pennant, being symmetrical, usually has a more neutral slope during consolidation, purely representing a pause before continuation.
Understanding these distinctions is important for accurate pattern identification. While all three can represent trend continuation, their specific shapes provide slightly different insights into the market’s current state of equilibrium and potential future velocity. Pennants suggest a swift, tight period of decision-making after a strong burst, often leading to another sharp move.
Let’s take another look at the psychology, but from a slightly more advanced perspective. The pennant phase can be seen as a ‘distribution’ or ‘accumulation’ zone in miniature. In a bullish pennant, despite some profit-taking, the fact that the price holds within a tightening range, forming higher lows, indicates that committed buyers are absorbing the selling pressure relatively easily. New buyers are entering before significant price drops occur, suggesting underlying strength.
The decreasing volume within the pennant is key psychological evidence. It shows that the ‘debate’ between buyers and sellers is happening with fewer participants or with less conviction from the sellers. If there was strong selling pressure, volume would likely remain high during the consolidation, and the pattern might look different (e.g., a distribution pattern or a bearish flag). The low volume signals that the majority of participants are either holding their positions (bulls waiting for continuation) or waiting for a clearer signal (neutral traders). The volume spike on breakout is the psychological confirmation that the neutral and waiting participants have now jumped decisively onto the bullish side.
From a behavioral finance perspective, the flagpole represents a period dominated by ‘herding’ or ‘momentum’ traders. The pennant represents a shift to ‘value’ or ‘contrarian’ traders entering (buying the dip within the consolidation) and ‘profit-taking’ traders exiting. The breakout represents the return of ‘momentum’ traders and potentially ‘breakout’ traders, leading to renewed herding behavior in the direction of the original trend.
For experienced traders, incorporating bullish pennants into more complex analysis can enhance strategy. Here are a few advanced considerations:
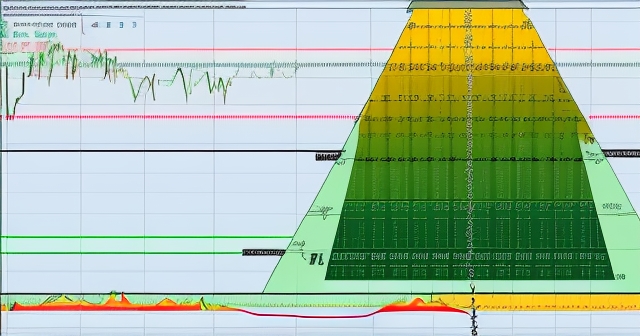
- Fibonacci Analysis: The consolidation phase of a pennant sometimes respects Fibonacci retracement levels from the flagpole move. A shallow retracement (e.g., only to the 38.2% or 50% level) within the pennant can indicate significant strength. Potential price targets post-breakout might also align with Fibonacci extensions of the flagpole.
- Correlation Analysis: How does the asset you are trading correlate with others? If you see a bullish pennant on ETH, check if BTC or other major altcoins are showing similar strength or patterns. Correlated moves can add conviction. Similarly, understanding the relationship between Gold and currency strength or inflation expectations adds depth to that analysis.
- Intermarket Analysis: Sometimes, patterns in one market can influence another. For example, a strong move in Gold might correlate with specific movements in currency pairs or inflation-linked instruments.
- Automated Trading and Algorithms: Be aware that many trading algorithms are programmed to identify and trade classic chart patterns like bullish pennants. This can contribute to the speed and force of breakouts but also potentially to the speed of false breakouts as algorithms react to initial signals. Understanding this can help you anticipate potential market behavior around these patterns.
Always remember that technical analysis is a tool to understand probabilities, not predict the future with certainty. A bullish pennant is a signal, a high-probability setup, but it exists within a larger market context. Geopolitical events, economic news, regulatory changes, and overall market sentiment can override even the strongest technical patterns. Therefore, while focusing on the pattern, keep an eye on the broader landscape. How does this pattern fit into the asset’s longer-term trend? What is the overall health of the market? Is there major news on the horizon that could invalidate the setup?
The bullish pennant pattern is a classic and powerful continuation signal in technical analysis. It represents a brief, low-volume consolidation following a strong upward price movement, suggesting that the initial bullish momentum is merely pausing before resuming. Understanding its anatomy – the flagpole, the pennant formation, and the breakout – is the first step.
Crucially, confirming the pattern with volume analysis (high volume on the flagpole and breakout, low volume during consolidation) and complementary technical indicators like RSI, MACD, and Bollinger Bands significantly increases its reliability. We’ve seen how analysts are identifying these patterns across diverse markets, from leading cryptocurrencies like Ethereum, Mantle, and Binance Coin, suggesting potential for significant rallies with clear price targets, to traditional assets like Gold, where the pattern might signal continuation despite conflicting signals.
Implementing a trading strategy based on a bullish pennant requires careful execution, whether you choose a conservative post-breakout entry, a more aggressive approach, or patiently wait for a retest. Most importantly, rigorous risk management is paramount. Setting appropriate stop-losses below the pattern’s invalidation point and calculating position sizes based on your risk tolerance are essential steps to protect your capital from the inevitable false breakouts and pattern failures that occur in dynamic markets.
For traders seeking platforms that offer the necessary tools for technical analysis and access to a wide range of markets where these patterns appear, from crypto to Forex and other CFDs, researching platforms is key. If you are looking for a platform with comprehensive offerings for technical traders, Moneta Markets is an option worth considering, known for its variety of instruments and platform choices like MT4, MT5, and Pro Trader.
bullish pennant patternFAQ
Q:What is a bullish pennant pattern?
A:A bullish pennant pattern is a technical analysis pattern that suggests a continuation of an upward trend after a period of consolidation following a strong price movement.
Q:How can I identify a bullish pennant?
A:A bullish pennant can be identified by the preceding strong price movement (flagpole), followed by a symmetrical consolidation triangle, and finally a breakout above the upper trendline with increased volume.
Q:What role does volume play in validating a bullish pennant?
A:Volume is critical; high volume during the flagpole and breakout phases confirms strength, while low volume during consolidation indicates the equilibrium between buyers and sellers, validating the pattern.