Understanding the Hammer and Inverted Hammer: Potential Bullish Reversal Signals in Forex Trading
Welcome, traders. Navigating the dynamic landscape of Forex can feel like charting unknown waters, especially when you’re just starting out or aiming to refine your technical analysis skills. Candlestick patterns serve as our compass and sextant in this journey, offering visual clues about market sentiment and potential price direction. Among the most compelling signals that suggest a shift in momentum after a price decline are the Hammer and Inverted Hammer patterns.
Think of these patterns not just as shapes on a chart, but as a brief, intense story told by buyers and sellers during a specific period. Understanding this narrative is key to unlocking their potential utility in your trading strategy. They can appear across various timeframes, from minute charts to weekly charts, making them versatile tools for different trading styles. But how do we correctly identify them, what do they truly signify, and most importantly, how can we integrate them into a robust trading plan? Let’s delve deep into these powerful patterns.

At first glance, these patterns might seem simple, but their specific structure is crucial for accurate identification. Both the Hammer and the Inverted Hammer share key characteristics, yet their visual presentation and shadow direction are distinct, which is vital for interpretation.
A Hammer candlestick is a bullish reversal pattern that typically appears after a discernible downtrend. Visually, it features:
- A small real body, which represents the range between the opening and closing prices. The color of the real body (bullish/green or bearish/red) is less critical than the overall shape and context, though a bullish body can sometimes add slight conviction.
- A long lower shadow (or tail). This shadow is significantly longer than the real body, ideally two to three times the length of the body or even more.
- A very short or non-existent upper shadow. The high of the period is typically very close to or the same as the open or close.
Picture a traditional carpenter’s hammer: a compact head at the top and a long handle pointing downwards. That’s the shape you’re looking for on your chart.
The Inverted Hammer candlestick, also a potential bullish reversal pattern, shares some traits but is flipped upside down. It also appears after a downtrend and is characterized by:
- A small real body, similar to the Hammer. Again, the color is of secondary importance to the shape and context.
- A long upper shadow. This shadow is much longer than the real body, usually two to three times its length or more.
- A very short or non-existent lower shadow. The low of the period is typically very close to or the same as the open or close.
Imagine an upside-down hammer, with the handle pointing upwards. That’s the Inverted Hammer.
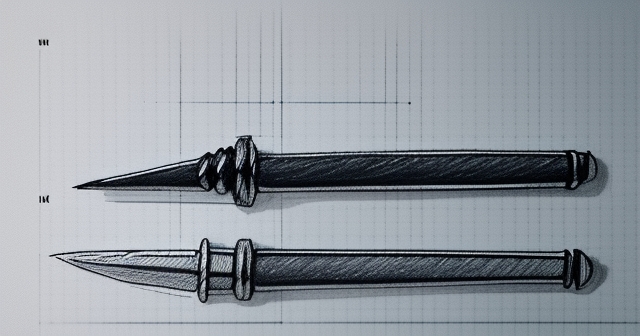
The location of the small real body relative to the shadows is key. For a Hammer, the body is near the top of the candlestick’s total range for that period. For an Inverted Hammer, the body is near the bottom of the candlestick’s total range.
Understanding the market psychology embedded within these patterns is where their true power lies. They are not merely abstract shapes; they are a graphical representation of a specific battle that occurred between buyers (bulls) and sellers (bears) during the timeframe of the candle’s formation.
Let’s break down the story of a Hammer forming after a persistent downtrend:
- The period opens, and sellers remain in control, continuing to push the price lower, often creating a new low for the recent price action.
- Price reaches an extreme low point, perhaps hitting a level where buyers perceive the asset as significantly undervalued or where large buy orders are clustered.
- Suddenly, a strong wave of buying pressure enters the market. Buyers step in aggressively, absorbing all the selling pressure and driving the price back up.
- This buying momentum is so strong that it pushes the price back up towards the upper end of the period’s range, resulting in a small real body near the high and leaving that long lower shadow as a testament to the sellers’ failed attempt to keep the price down.
The long lower shadow tells us that sellers tried their best to drive the price down, but they were ultimately rejected by determined buyers. It’s a potential signal that the selling pressure is exhausting itself and that buying interest is emerging. The bears pushed, but the bulls pushed back harder, managing to recover most of the losses and close near the opening price or even higher.
Now, consider the psychology of an Inverted Hammer forming after a downtrend:
- The period opens, and initially, buyers seem to gain the upper hand, attempting to reverse the trend by pushing the price significantly higher.
- However, this upward move is met with resistance from sellers. Sellers step back in, trying to regain control and push the price back down.
- The sellers manage to push the price down towards the lower end of the period’s range, resulting in a small real body near the low. The long upper shadow shows the buyers’ initial attempt at a rally that was ultimately pushed back by sellers, but critically, the price did not make new lows and managed to close near the open.
The long upper shadow of the Inverted Hammer indicates that while buyers attempted to rally the price, sellers managed to push it back down. However, the important part is that the price did not continue its downward trajectory significantly within that period; it held its ground near the open/low. This can still suggest a potential weakening of the downtrend, as buyers were able to mount a challenge, even if they couldn’t sustain the high. It’s like the buyers tested the resolve of the sellers at higher levels and found resistance, but the sellers couldn’t push the price back to the deep lows seen previously.
The psychological dynamics described above are precisely why the Hammer and Inverted Hammer are considered potential bullish reversal signals. They appear at the end of a downtrend, acting like a stop sign or a yellow light for the prevailing bearish movement.
In a sustained downtrend, sellers are consistently stronger than buyers, pushing prices lower with each period. New lows are regularly made, and rallies are quickly sold off. The appearance of a Hammer or Inverted Hammer disrupts this pattern.
| Pattern | Indication | Market Context |
|---|---|---|
| Hammer | Potential bullish reversal | After a downtrend |
| Inverted Hammer | Potential bullish reversal | After a downtrend |
| Hanging Man | Potential bearish reversal | After an uptrend |
| Shooting Star | Potential bearish reversal | After an uptrend |
For the Hammer, the strong buying interest that emerged to push the price back up from the lows is a significant event. It suggests that the price level reached during the long lower shadow was perceived as a potential bottom, and buyers were willing to defend it aggressively. This rejection of lower prices is the core of the bullish signal. It’s the market whispering, “Maybe we’ve gone down far enough.”
For the Inverted Hammer, while the strong buying push was partially rejected, the fact that price closed near the open/low rather than continuing to plummet indicates that the selling pressure might be losing its conviction. Buyers were able to make a significant attempt to rally, suggesting their presence is growing. The failure of sellers to drive the price significantly lower than the open is the key takeaway. It suggests the downtrend’s momentum is stalling, and buyers are probing for higher prices.
These patterns don’t guarantee a reversal. The market is complex, and one candle, no matter how distinctive, rarely tells the whole story. However, they serve as valuable alerts that the balance of power might be shifting. They tell us to pay close attention to the subsequent price action, as it will provide the necessary confirmation.
The Crucial Role of Confirmation
Identifying a Hammer or Inverted Hammer is only the first step. Relying solely on the appearance of these patterns without further evidence can lead to false signals and potential losses. This is where the concept of confirmation becomes paramount in your trading strategy.
Confirmation essentially means waiting for the market to provide additional evidence that supports the potential reversal suggested by the pattern. It validates the signal and significantly increases the probability of the reversal occurring.
For both the Hammer and the Inverted Hammer, the most common form of confirmation is a bullish move in the subsequent period (the candle immediately following the pattern).
- For a Hammer: Confirmation is typically achieved if the candle immediately following the Hammer opens higher than the Hammer’s close and, more importantly, closes significantly above the Hammer’s real body. A strong bullish candle with a higher close reinforces the idea that buyers have indeed taken control and are pushing prices upwards.
- For an Inverted Hammer: Confirmation is usually seen when the candle immediately following the Inverted Hammer opens and closes above the Inverted Hammer’s real body and preferably above the high of the Inverted Hammer. A strong move upwards that clears the high of the Inverted Hammer suggests that the buyers who tested the upper levels in the previous period are now successfully gaining traction.
Why is this confirmation so important? Because sometimes a Hammer or Inverted Hammer can form, but sellers regain control in the next period, pushing the price back down and continuing the original downtrend. This is a failed pattern, and trading without confirmation would have resulted in entering a trade just before the trend resumed against you.
Waiting for confirmation means you might enter the trade slightly later than if you traded the pattern purely on sight, but it dramatically improves your odds of entering a valid reversal. Think of it as waiting for the second shoe to drop, or getting a second opinion before making a big decision. It’s a crucial step in responsible trading.
Integrating Patterns with Other Technical Analysis Tools
While confirmation from the next candle is vital, the reliability of a Hammer or Inverted Hammer signal is further enhanced when used in conjunction with other technical analysis tools. No single indicator or pattern should be used in isolation. Combining them creates a confluence of signals, building a stronger case for a potential trading opportunity.
Here are some ways to integrate these patterns:
- Support Levels: A Hammer or Inverted Hammer forming right at or very near a significant support level (horizontal support, trendline support, or even a Fibonacci retracement level) is a particularly powerful signal. Support levels are areas where historical buying interest has emerged. A bullish reversal pattern appearing at such a level adds weight to the idea that buyers are stepping in again at a proven price floor.
- Trendlines: If a Hammer or Inverted Hammer forms upon testing a long-standing upward-sloping trendline (in the context of a potential counter-trend bounce, though less common) or, more typically, at the lower boundary of a descending channel, it can signal a potential move back up.
- Volume: Pay attention to the volume associated with the formation of the Hammer or Inverted Hammer candle and its confirmation candle. A Hammer or Inverted Hammer forming on significantly increased volume, especially the long shadow part of the move, suggests strong participation in the battle between buyers and sellers at that price level. Confirmation on strong volume further validates the strength of the bullish conviction. Conversely, a pattern on low volume might be less reliable.
- Moving Averages: The appearance of these patterns near key moving averages (like the 50-period, 100-period, or 200-period moving average) can also strengthen the signal, especially if the moving average is acting as dynamic support.
- Oscillators: Combining these patterns with oversold readings from oscillators like the Relative Strength Index (RSI) or Stochastic Oscillator can provide additional confidence. If a Hammer forms while the RSI is showing deeply oversold conditions (e.g., below 30), it reinforces the idea that the price is due for a bounce.
By layering these tools, you build a more comprehensive picture of the market’s state. A Hammer appearing at a major support level, confirmed by a strong bullish candle on high volume, with the RSI simultaneously exiting oversold territory, presents a much more compelling trade setup than the pattern alone.
Distinguishing from Bearish Counterparts: Hanging Man and Shooting Star
It is absolutely critical to understand that the shape of a Hammer or Inverted Hammer is only half the story. The context – specifically, whether the pattern appears after a downtrend or an uptrend – completely changes its interpretation. The patterns that look identical to the Hammer and Inverted Hammer but appear after an uptrend have distinctly bearish implications and are known as the Hanging Man and Shooting Star.
The Hanging Man looks exactly like a Hammer (small real body at the top, long lower shadow, short upper shadow) but appears at the end of an uptrend. Instead of suggesting buying pressure is emerging from lows, the long lower shadow in a Hanging Man suggests that sellers attempted to push the price significantly lower during the period, even though buyers managed to push it back up to close near the open/high. This inability of buyers to maintain the gains and the clear sign of selling pressure entering the market (the long lower shadow) is a potential warning that the bullish momentum is weakening.
The Shooting Star looks exactly like an Inverted Hammer (small real body at the bottom, long upper shadow, short lower shadow) but appears at the end of an uptrend. The long upper shadow here signifies that buyers tried to push price higher, but sellers stepped in forcefully and pushed the price back down to close near the open/low. This failed bullish push and the strong selling rejection from the highs is a potential signal that the buying pressure is being met with significant resistance, and the uptrend may be nearing its end.
Understanding this distinction is non-negotiable. A Hammer after a downtrend is potentially bullish. A Hanging Man after an uptrend is potentially bearish. An Inverted Hammer after a downtrend is potentially bullish. A Shooting Star after an uptrend is potentially bearish.
Imagine you see the Hammer shape. Your first question should be: “What was the preceding trend?” If the answer is “downtrend,” you consider it a potential bullish signal. If the answer is “uptrend,” you consider it a potential bearish signal (a Hanging Man). The same logic applies to the Inverted Hammer shape and its bearish twin, the Shooting Star.
Developing Trading Strategies with Hammer and Inverted Hammer Patterns
Once you can accurately identify a potential Hammer or Inverted Hammer after a downtrend and understand its psychology and context, how do you translate this into a practical trading strategy? Here are some common approaches and considerations:
Entry Strategy (Waiting for Confirmation):
- The most prudent approach is to wait for the confirmation candle to close bullishly after the Hammer or Inverted Hammer has formed.
- For a Hammer, an entry could be placed just above the high of the Hammer candle or just above the high of the confirmation candle.
- For an Inverted Hammer, an entry could be placed just above the high of the Inverted Hammer candle (as a break of the upper shadow’s high suggests buyers are overcoming the resistance shown in the pattern) or just above the high of the confirmation candle.
- Aggressive traders might enter closer to the close of the confirmation candle, while conservative traders might wait for a break above the confirmation candle’s high or a specific resistance level confirmed by the pattern.
Stop-Loss Placement:
- Proper stop-loss placement is crucial for managing risk. The logical place for a stop-loss when trading a Hammer or Inverted Hammer is typically just below the low of the pattern candle itself.
- For a Hammer, the stop-loss is placed a few pips below the low of the long lower shadow. If the price falls below this low, it invalidates the pattern’s bullish implication, suggesting sellers are still in control.
- For an Inverted Hammer, the stop-loss is also typically placed a few pips below the low of the real body (which is also the low of the entire candle range). If the price falls below this point, the reversal idea is likely false.
- Placing the stop here defines your maximum risk on the trade.
Target (Take Profit) Strategies:
- Unlike some patterns (like Head and Shoulders or Double Tops/Bottoms) that provide clear measured move targets, the Hammer and Inverted Hammer do not inherently offer a specific price target based solely on the pattern’s dimensions.
- Targets should be determined using other technical analysis methods, such as:
- Previous resistance levels.
- Fibonacci extension levels from the recent move.
- A fixed risk-reward ratio (e.g., aiming for a target 2 or 3 times the distance from your entry to your stop-loss).
- Trailing stops to lock in profits as the price moves in your favor.
- It’s essential to have a profit target or strategy before entering the trade.
Remember, no strategy is foolproof. These are potential signals, and even with confirmation, trades can fail. This is why risk management is not optional, but a mandatory component of your trading plan.
Applying Patterns Across Timeframes and Markets
One of the advantages of candlestick patterns is their universality. The principles behind the Hammer and Inverted Hammer are applicable across various financial markets – stocks, commodities, indices, and significantly for our discussion, Forex.
In Forex trading, these patterns can be observed on any currency pair, from major pairs like EUR/USD and GBP/USD to crosses like AUD/JPY or exotics. The psychology of buyers and sellers is the same regardless of the asset.
Furthermore, these patterns can appear on any timeframe you choose to analyze. You might see a Hammer forming on a 5-minute chart, suggesting a potential short-term bounce, or on a daily chart, indicating a potential major trend reversal. The significance of the pattern is often proportional to the timeframe on which it appears; a pattern on a higher timeframe (like daily or weekly) is generally considered more significant than one on a lower timeframe (like hourly or minute charts).
Trading short timeframes (e.g., 1-minute, 5-minute) using these patterns requires very fast decision-making and execution due to rapid price movements. Longer timeframes (e.g., daily, weekly) offer slower, potentially more reliable signals, but require more patience for both pattern formation and trade duration.
Experienced Forex traders often use multiple timeframes. They might identify a potential long-term trend or support level on a daily chart and then drop down to an hourly or 4-hour chart to look for a Hammer or Inverted Hammer confirmation signal to pinpoint their entry.
When you’re ready to apply this knowledge in live Forex trading or explore more CFD products, selecting a reliable platform is crucial. If you’re considering starting or switching brokers, Moneta Markets is a worthy platform to explore. It’s based in Australia and offers a wide array of over 1000 financial instruments, catering well to both beginner and experienced traders.
Applying these patterns requires practice. Use a demo account to practice identifying them on various pairs and timeframes before risking real capital. See how they behave in different market conditions and how often they are followed by confirmation.
Potential Pitfalls and Limitations
While valuable, it’s important to approach Hammer and Inverted Hammer patterns with a realistic understanding of their limitations. They are not infallible predictors of market movement.
- False Signals: The most common pitfall is the occurrence of false signals. A pattern might form, even with apparent confirmation, only for the price to reverse direction shortly after. This is why stop-losses are essential.
- Market Conditions: These patterns are generally more reliable in trending or range-bound markets with clear support/resistance levels. In choppy, highly volatile, or news-driven markets, signals can be erratic and less dependable.
- Lack of Price Targets: As mentioned, the patterns themselves don’t provide profit targets, requiring you to rely on other tools, which adds another layer of analysis and potential subjectivity.
- Subjectivity in Identification: While the rules are clear, what constitutes a “long” shadow or a “small” body can sometimes feel subjective, especially when the proportions are borderline. Consistency in your interpretation is key.
- Over-Reliance: Trading solely based on candlestick patterns without considering the broader market context, trend, news, or other indicators is a common mistake. Patterns are best used as triggers or confirmation signals within a larger analytical framework.
Acknowledging these limitations isn’t a reason to dismiss the patterns, but rather a call for caution and disciplined application. They are tools to be used intelligently, not magic bullets.
Risk Management: Protecting Your Capital
We’ve touched upon stop-losses, but let’s emphasize the critical importance of comprehensive risk management when trading any pattern, including the Hammer and Inverted Hammer.
Every trade based on a technical signal carries a probability of success and a probability of failure. Your goal as a trader is not to be right 100% of the time (which is impossible), but to manage your risk so that losing trades have minimal impact on your capital, while winning trades allow your account to grow.
Key risk management principles when trading these patterns:
- Position Sizing: Never risk more than a small percentage of your total trading capital on any single trade (commonly 1-2%). This means the size of your trade (the number of lots or units) should be calculated based on the distance from your entry price to your stop-loss price, and your maximum acceptable dollar risk.
- Stop-Loss Placement: We discussed placing stops below the pattern’s low. Ensure you adhere to this and never move your stop-loss further away from your entry in the hope that the market will turn around.
- Risk-Reward Ratio: Always aim for trades where your potential profit (distance to your take-profit target) is at least equal to, but preferably greater than, your potential loss (distance to your stop-loss). A common goal is a 1:2 or 1:3 risk-reward ratio. Don’t take trades where the potential profit is less than the potential loss, even if the signal looks good.
- Avoid Over-Leveraging: Leverage can amplify profits but also losses. Use leverage responsibly, especially in the volatile Forex market.
- Trading Plan: Have a clear plan for every trade: entry point, stop-loss, target, and position size, *before* you enter the trade. Stick to your plan.
Integrating proper risk management turns a potential signal into a controlled opportunity. It’s the difference between gambling and professional trading.
If you are looking for a regulated broker for global trading, Moneta Markets is a strong contender. It holds multi-jurisdictional regulatory licenses, including from FSCA, ASIC, and FSA, offers segregated client funds, free VPS, and 24/7 multilingual customer support, making it a preferred choice for many traders globally.
Examples and Practical Considerations in Forex
Let’s consider a few hypothetical examples of how these patterns might play out on Forex charts:
Imagine looking at the AUD/USD daily chart. Price has been in a steady downtrend for several weeks. You identify a clear Hammer candlestick forming right at a historical support level from six months ago. The Hammer has a very long lower wick, indicating a strong rejection of lower prices during the day. The next day, AUD/USD opens higher and closes significantly above the Hammer’s close, forming a strong bullish candle. This provides the necessary confirmation. Based on this confluence (downtrend + support level + Hammer + bullish confirmation), you might consider a long position, placing your stop-loss just below the Hammer’s low. Your target could be the next significant resistance level higher up on the chart.
Now consider the USD/CAD 4-hour chart. Price has been falling, approaching the lower boundary of a descending channel. You spot an Inverted Hammer forming. While its upper shadow was pushed back down by sellers, it closed near the open, and importantly, price did not break below the channel support. The next 4-hour candle opens higher and pushes through the high of the Inverted Hammer’s upper shadow, closing as a strong bullish candle. This combination (downtrend + channel support + Inverted Hammer + bullish confirmation) might lead you to consider a buy trade. Your stop-loss would be placed below the Inverted Hammer’s low, and your target might be the upper boundary of the descending channel.
| Example | Description | Role of Confirmation |
|---|---|---|
| AUD/USD Daily | Hammer at historical support | Confirmed by strong bullish candle |
| USD/CAD 4-Hour | Inverted Hammer at channel support | Confirmed by upward breakout candle |
These are just illustrative scenarios. Real-world charts are rarely this clean. You will encounter variations in shadow length, body size, and the strength of the confirmation candle. Practice on historical data (backtesting) and demo accounts to hone your eye for identifying the most reliable-looking patterns and confirming signals.
Furthermore, always be aware of economic news releases. High-impact news can cause sudden, volatile price swings that can invalidate even the strongest technical signals. Trading around major news events requires a different approach or simply staying out of the market until volatility subsides.
When choosing a trading platform for Forex and other instruments, Moneta Markets‘ flexibility and technological edge are worth noting. They support popular platforms like MT4, MT5, and Pro Trader, offering high-speed execution and competitive spreads, which can provide a solid trading experience.
Conclusion: Mastering the Hammer and Inverted Hammer in Your Arsenal
The Hammer and Inverted Hammer candlestick patterns are powerful visual tools that, when understood and applied correctly, can significantly enhance your ability to spot potential bullish reversals after a downtrend. They tell a clear story of buyers potentially stepping in to counter selling pressure, suggesting a possible shift in market momentum.
However, like all technical analysis tools, they are most effective when not used in isolation. Remember the key principles: accurate identification of the pattern’s shape and its position within a preceding downtrend; understanding the underlying psychology of the battle between buyers and sellers; and, most importantly, waiting for crucial confirmation from subsequent price action.
Integrating these patterns with other technical tools – such as support and resistance levels, trendlines, volume analysis, and technical indicators – provides a more robust foundation for your trading decisions. Be mindful of the distinct difference between these bullish patterns and their bearish counterparts, the Hanging Man and Shooting Star, which appear in uptrends with opposite implications.
Finally, always, always prioritize risk management. Define your entry, stop-loss, and target *before* entering a trade, size your positions appropriately, and never risk more than you can afford to lose. The market will always present opportunities; your primary goal is to preserve capital so you can be there to seize them.
By diligently studying these patterns, practicing their identification, and applying them as part of a comprehensive, disciplined trading strategy, you can potentially improve your ability to navigate the Forex market and capitalize on key turning points.
hammer forexFAQ
Q:What is a Hammer candlestick pattern?
A:A Hammer is a bullish reversal pattern with a small body and a long lower shadow, indicating potential buying interest after a price decline.
Q:How can I confirm the validity of a Hammer pattern?
A:Confirmation typically comes from the next candle closing significantly above the Hammer’s real body, indicating that buyers have taken control.
Q:Can Hammer patterns be used in other markets?
A:Yes, Hammer patterns can be observed in various financial markets, such as stocks, commodities, and Forex, across all timeframes.
