
Mastering Continuation Signals: Identifying and Trading Flag Patterns in Forex
Welcome, fellow traders and aspiring market navigators! As you delve deeper into the fascinating world of financial markets, particularly Forex, you quickly discover that understanding price action is paramount. Technical analysis provides us with a powerful lens through which to view market behavior, and among its many tools, chart patterns stand out as recurring formations that can offer insights into future price movements. Think of them as footprints left behind by the collective actions of millions of traders worldwide. Today, we’re focusing on one of the most popular and potentially reliable continuation patterns: the flag pattern. These patterns primarily signal that a prevailing trend is likely to resume after a brief pause. They are valuable across various financial markets, but they hold particular relevance in the highly liquid and dynamic Forex market. Understanding their structure – the distinctive ‘pole’ and ‘flag’ components – and knowing how to trade them can significantly enhance your analytical toolkit and trading strategy.
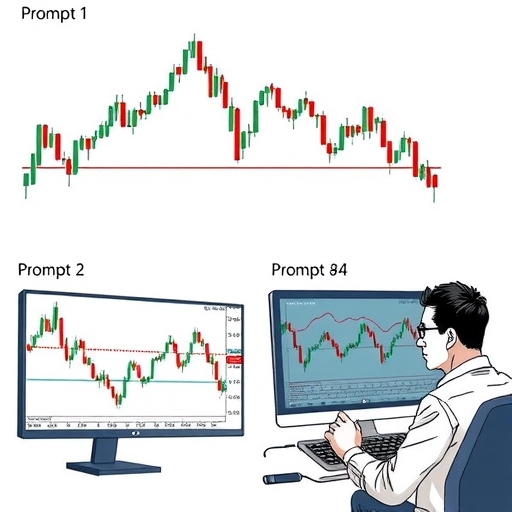
Let’s break down what a flag pattern actually is and why it forms. Imagine a strong, almost vertical price move – this is the ‘pole’. It represents a rapid and significant shift in price, driven by strong buying (in an uptrend) or selling (in a downtrend) pressure. This move is typically impulsive and covers substantial ground in a relatively short time frame. After such an explosive move, markets rarely continue straight up or down indefinitely. Traders who entered early may start taking profits, or those who missed the initial move may hesitate, leading to a period of consolidation. This pause is where the ‘flag’ itself forms.
The ‘flag’ is a consolidation phase characterized by price moving within two parallel trendlines. These trendlines typically slope gently against the direction of the preceding pole, or sometimes they are simply horizontal. For a bullish flag pattern (following an uptrend pole), the flag will usually slope downwards or be horizontal. For a bearish flag pattern (following a downtrend pole), the flag will usually slope upwards or be horizontal. It’s crucial that these boundaries are parallel; this distinguishes a flag from a pennant (which has converging trendlines, forming a triangle shape). The flag represents a brief battle between buyers and sellers, but crucially, it occurs *within* the context of the strong preceding trend. It’s a temporary equilibrium where the market catches its breath.
Why does this happen? The pole shows strong conviction in one direction. The flag is a period of profit-taking by early participants or a moment of indecision. However, if the dominant underlying force (buyers in an uptrend, sellers in a downtrend) is still strong, this consolidation will resolve with price breaking out of the flag in the original direction of the pole. The pattern essentially suggests that the energy built up during the pole wasn’t fully spent and is ready to fuel the next leg of the move.
Recognizing these two distinct components – the sharp pole and the contained, parallel-sided flag – is the first step to effectively identifying flag patterns on your charts. As you look at price action on various timeframes, you’ll start spotting these formations more frequently, whether you’re analyzing EURUSD or looking at Gold.
Key aspects of understanding flag patterns:
- Flag patterns indicate potential continuation of the previous trend.
- Understanding their anatomy can aid in better trading decisions.
- Timeframe analysis is crucial to spot these patterns effectively.
Bullish vs. Bearish Flags: Identification and Trend Implication
Now that we understand the basic anatomy, let’s look at the two primary types: the bullish flag and the bearish flag. Their visual characteristics are mirrors of each other, determined by the direction of the preceding trend and the subsequent consolidation.
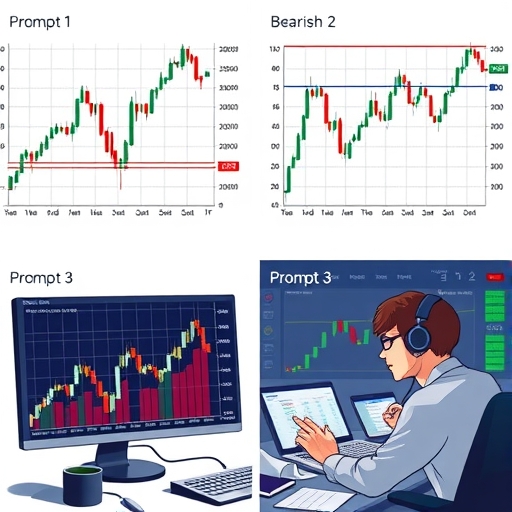
A bullish flag pattern occurs within a clear uptrend. The ‘pole’ is a sharp upward surge in price. Following this powerful move, price enters a consolidation phase, forming the ‘flag’. This flag is typically a rectangle bounded by two *downward-sloping* or horizontal parallel trendlines. The downward slope indicates that during this pause, sellers are pushing price lower, but they aren’t strong enough to break the underlying upward momentum significantly. Each dip within the flag is met with buying pressure, keeping price contained within the channel. The pattern is completed and the bullish signal is confirmed when price breaks out convincingly *above* the upper trendline of the flag. This breakout signals the likely continuation of the original uptrend.
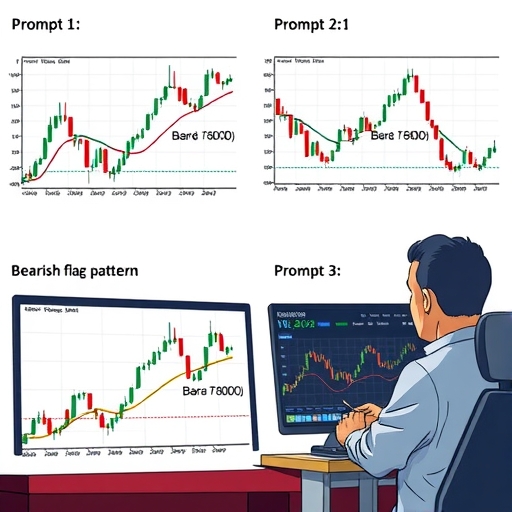
Conversely, a bearish flag pattern forms within a clear downtrend. Here, the ‘pole’ is a sharp downward plunge in price. The subsequent ‘flag’ is a consolidation phase bounded by two *upward-sloping* or horizontal parallel trendlines. The upward slope suggests that during this pause, buyers are attempting to push price higher, perhaps covering short positions or trying to find a bottom. However, the dominant selling pressure prevents a significant rally, keeping price contained within the channel. The pattern is completed and the bearish signal is confirmed when price breaks out convincingly *below* the lower trendline of the flag. This breakout signals the likely continuation of the original downtrend.
It’s important to remember that flag patterns are predominantly continuation patterns. Their formation within an established trend strongly suggests that the trend is merely pausing, not reversing. While rare instances of patterns failing or becoming reversal signals exist, the standard interpretation of a flag is a signal that the original trend will likely resume with renewed vigor. Accurately identifying the shape, slope, and parallel boundaries of the flag relative to the pole and the overall trend is crucial for proper pattern identification and interpretation.
| Flag Type | Description | Price Action |
|---|---|---|
| Bullish Flag | Formed in an uptrend, with downward-sloping or horizontal lines. | Price breaks above the upper trendline to continue uptrend. |
| Bearish Flag | Formed in a downtrend, with upward-sloping or horizontal lines. | Price breaks below the lower trendline to continue downtrend. |
Trading Strategies and Entry Points: Catching the Breakout
Trading flag patterns revolves around capitalizing on the anticipated trend continuation following the consolidation breakout. The core strategy involves identifying the pattern and then waiting for a confirmed move beyond the flag’s boundaries in the direction of the preceding pole.
For a bullish flag, traders typically look for an entry point when price breaks decisively above the upper trendline of the flag. This breakout confirms that the buying pressure has overwhelmed the temporary selling/consolidation within the flag and the uptrend is resuming. Entry can be made immediately upon a convincing break (a strong closing candle above the line), or you might wait for a retest of the broken trendline as support before entering. This second approach can sometimes offer a slightly better entry price and adds a layer of confirmation, though it also carries the risk of missing the move if price doesn’t retest.
For a bearish flag, the entry point is typically triggered when price breaks decisively below the lower trendline of the flag. This breakout confirms that the selling pressure is back in control and the downtrend is continuing. Similar to the bullish case, entry can be aggressive on the initial break or more conservative upon a potential retest of the broken trendline as resistance.
What makes a breakout “decisive”? Look for a strong candlestick that closes outside the flag boundaries. Ideally, you want to see increasing volume accompanying the breakout candle (more on volume next). Avoid entering on weak breaches that quickly snap back inside the flag – these are potential false breakouts. Patience is key here; waiting for confirmation can prevent getting caught in traps.
Remember, flag patterns are signals within a larger context. Always consider the overall trend on multiple timeframes. A flag on a 5-minute chart within a daily downtrend is interpreted differently than a flag on a daily chart within a multi-year uptrend. The breakout point serves as your potential trigger to join the dominant move.
Volume and Other Confirmation Tools: Strengthening the Signal
While the visual price structure of a flag pattern is fundamental, smart traders rarely rely on a single pattern in isolation. Combining pattern recognition with other technical tools significantly enhances the reliability of the signal and helps differentiate genuine breakouts from false ones. Volume is arguably the most important complementary tool for validating flag patterns.
During the formation of the ‘pole’, you should ideally see high or increasing volume, indicating strong conviction behind the initial move. As price consolidates within the ‘flag’, volume should typically *decrease* or remain relatively low. This volume contraction suggests that the period of profit-taking or indecision is occurring on lower participation, which is characteristic of a temporary pause rather than a fundamental shift in sentiment. The key validation comes at the breakout: a genuine breakout should be accompanied by a noticeable *increase* or spike in volume. This surge in participation signals that new money is entering the market in the direction of the trend, confirming the strength of the breakout and the likely continuation of the move.
What if the breakout occurs on low volume? This is a yellow flag (pun intended!). A low-volume breakout is less convincing and has a higher probability of being a false breakout or a trap. Always look for that volume confirmation.
| Confirmation Tools | Description |
|---|---|
| Volume | High volume during the pole, low during the flag, high again at breakout. |
| Moving Averages | Assess the relationship of the flag to significant MAs. |
| Oscillators | Verify momentum aligns with breakout direction, look for divergence. |
| Support and Resistance | Breakouts at key levels have higher likelihood of success. |
Using these tools in conjunction with flag pattern identification helps you build a stronger case for a potential trade. It moves beyond simply seeing a shape on a chart to understanding the underlying market dynamics that are validating or questioning the pattern’s implication.
Managing Risk and Navigating Common Pitfalls
No trading strategy or pattern is foolproof, and flag patterns are no exception. It’s essential to be aware of the potential risks and common pitfalls and to implement robust risk management techniques to protect your capital. The primary risks associated with trading flags are false breakouts and subjective interpretation.
A false breakout (or ‘whipsaw’) occurs when price briefly moves beyond the flag’s trendline, triggering entry signals for breakout traders, but then quickly reverses back inside the flag or even reverses the entire trend. This can lead to losses if your stop loss isn’t placed correctly or if you don’t wait for sufficient confirmation. False breakouts can be caused by news events, sudden shifts in sentiment, or simply algorithmic noise around pattern boundaries. Waiting for candle closes outside the flag, checking for volume confirmation, and using other indicators can help mitigate this, but they don’t eliminate the risk entirely.
Subjective interpretation is another challenge. Drawing trendlines, especially the parallel lines of the flag, can sometimes be subjective. Where exactly do you place the line? Do you include wicks or just body closes? Slight variations can change the perceived breakout point. Consistency in your charting approach is vital, but recognizing that others may draw the lines differently helps manage expectations.
This is why risk management is not optional; it’s mandatory. For any trade based on a flag pattern, you must define your stop loss *before* entering the trade. The stop loss is the price level at which you will exit the trade to limit your potential loss if the pattern fails or the market moves against you. We’ll discuss specific stop-loss placement strategies next, but the principle is key: know your maximum risk per trade. Position sizing – determining how many units or lots to trade based on your stop loss and your overall account risk tolerance – is also critical. Never risk more than a small percentage of your total trading capital on any single trade.
Other pitfalls include trading patterns that aren’t truly formed (e.g., calling something a flag after only a few consolidation bars), trading patterns in choppy or range-bound markets where trends are unclear, or failing to consider the broader market context, such as significant upcoming economic news events that could invalidate technical patterns.
Setting Stop Losses and Take Profits: Defining Your Exit Strategy
A sound trading plan requires not just an entry strategy but also clearly defined exit strategies: where you will cut losses (stop loss) and where you will take profits (take profit). For flag patterns, there are standard approaches to setting these levels.
Stop Loss Placement: The most common and logical place to set a stop loss when trading a flag pattern breakout is just outside the opposite side of the flag from the breakout.
- For a bullish flag breakout (above the upper trendline), the stop loss is typically placed just below the low of the flag’s consolidation range. This level represents a significant point within the pattern; if price falls back below this level after breaking out upwards, it strongly suggests the breakout was false or the pattern has failed.
- For a bearish flag breakout (below the lower trendline), the stop loss is typically placed just above the high of the flag’s consolidation range. If price moves back above this level after breaking out downwards, the bearish signal is likely invalidated.
Placing the stop loss tightly just beyond the flag’s boundary helps keep your risk contained relative to the potential reward. However, setting it too tight risks getting stopped out by normal market noise or minor pullbacks. You might consider placing it a few pips/points beyond the absolute low/high of the flag to give the trade a little room to breathe, but this is a trade-off between tighter risk and potential whipsaws.
Take Profit Targets: A classic method for setting a take profit target after a flag pattern breakout is to use the length of the ‘pole’. The idea is that the move after the breakout will be similar in magnitude to the initial impulsive move that formed the pole.
- For a bullish flag, measure the vertical distance from the start of the pole to the point where price entered the flag consolidation. This distance is the ‘pole length’. Project this same distance upwards starting from the breakout point (or sometimes from the low of the flag). This projected level is your initial take profit target.
- For a bearish flag, measure the vertical distance from the start of the pole to the point where price entered the flag consolidation. Project this distance downwards starting from the breakout point (or sometimes from the high of the flag). This projected level is your initial take profit target.
This ‘pole length projection’ provides a logical and historically observed price target. You might use this as your primary target, or perhaps take partial profits at this level and let the rest of the position run with a trailing stop loss. Other potential take profit targets could be based on significant historical support/resistance levels or Fibonacci extension levels. Always aim for a favorable risk-to-reward ratio (e.g., aiming to make at least 1.5x or 2x your risked amount). Remember, setting these levels is part of your pre-trade planning; define them before you enter the market.
Flag Patterns Across Different Markets: A Universal Tool, With Nuances
One of the reasons for the popularity of flag patterns is their applicability across a wide range of financial markets and timeframes. You will find these formations in Forex currency pairs like EURUSD, in individual Stocks (e.g., a strong earnings report followed by consolidation), in Commodities like Gold, Silver, or WTI Crude, and even in the volatile Cryptocurrency markets.
While the basic structure and interpretation remain consistent, the behavior of flag patterns can be influenced by market-specific characteristics:
- Forex: The Forex market is known for its high liquidity and 24/5 trading. Flag patterns can form frequently, especially after major economic data releases or news events that cause sharp initial moves. The speed of breakouts in Forex can be very fast, particularly during peak trading sessions (like the London or New York sessions). The high liquidity can sometimes lead to cleaner pattern formations, but also potential for fast whipsaws around news. If you’re considering diving into Forex trading or exploring various CFD commodities, Moneta Markets is a platform worth looking into. Based in Australia, they offer over 1000 financial instruments, suitable for both beginners and experienced traders.
- Stocks: Stock prices are heavily influenced by company-specific news (earnings reports, product launches), sector trends, and overall market sentiment. Flag patterns often form after significant news-driven moves. Volume analysis is particularly crucial in stocks, as institutional activity plays a large role. Breakouts might align with market open/close times or specific news catalysts.
- Commodities: Commodity markets (like Oil or Metals) are often driven by supply/demand fundamentals, geopolitical events, and economic indicators. Flag patterns can appear following sharp moves related to these factors. Volatility can be high, which might lead to larger poles and more explosive breakouts.
- Cryptocurrencies: Crypto markets are known for their extreme volatility and decentralized nature. Flag patterns are common here, especially after periods of rapid price appreciation or depreciation. However, be mindful of the influence of market sentiment, social media, and the fact that these markets trade 24/7, potentially leading to breakouts at any time. Volume confirmation is also important, though data reliability can sometimes be an issue on less regulated exchanges.
Regardless of the market, the core principles apply: identify the pole and flag, look for the breakout, and manage your risk. However, understanding the unique dynamics of the market you’re trading in will help you better anticipate the potential speed, volatility, and confirmation signals associated with flag patterns in that specific environment.
Advanced Applications and Combining Indicators
For traders looking to move beyond basic pattern recognition, flag patterns can be integrated into more sophisticated trading strategies and combined with advanced technical analysis tools. This layering of analysis can help filter signals, improve entry/exit timing, and potentially increase profitability.
We’ve already touched on combining flags with volume and standard indicators like Moving Averages, MACD, and RSI. But you can explore further:
- Fibonacci Analysis: Flag consolidation phases often respect Fibonacci retracement levels. For example, in a bullish flag, the pullback (the flag itself) might find support around the 38.2% or 50% retracement level of the pole’s length. This adds another layer of confirmation to the flag’s boundaries. After the breakout, Fibonacci extension levels can be used to project potential take-profit targets beyond the pole length projection.
- Elliott Wave Theory: If you subscribe to Elliott Wave principles, a flag pattern can often be interpreted as a corrective wave structure (like a B wave or part of a complex correction) occurring within a larger impulsive wave sequence (the pole). Identifying the pattern within this broader wave count can provide context and reinforce the continuation signal.
- Gann Analysis: Traders using Gann tools might look for flags forming at specific price and time points, or coinciding with Gann angles, adding a geometric or cyclical element to the analysis.
- Demark Trendline Indicator: Some traders use specific indicators like the Demark trendline indicator to help objectively draw potential trendlines and channels, which could be applied to identifying the parallel boundaries of the flag.
Furthermore, flags can be part of larger patterns or setups. For instance, a flag might form as a pullback to a key support or resistance level that was previously broken, or it could be the ‘handle’ part of a larger Cup and Handle pattern. Understanding how patterns interact and combine on different timeframes is a hallmark of advanced technical analysis.
Algorithmic traders also incorporate flag pattern logic into automated systems, defining specific parameters for identifying the pole, the flag’s dimensions, volume characteristics, and breakout conditions to generate automated trading signals or executions.
Choosing the right trading platform is crucial for implementing these advanced strategies. When you are looking for a broker that supports multiple platforms and advanced tools, Moneta Markets‘ flexibility and technical advantages are worth noting. They support popular platforms like MT4, MT5, and Pro Trader, offering high-speed execution and low spread settings for a good trading experience.
Real-World Examples and Context
Observing flag patterns in action on live charts is the best way to solidify your understanding. While specific historical examples from the provided data aren’t detailed with charts, the concepts apply universally. Imagine seeing a strong upward move in EURUSD following positive economic news from the Eurozone. Price then starts drifting sideways or slightly downwards, forming tight oscillations within a parallel channel. Volume dips during this consolidation. Suddenly, a large bullish candle pierces the upper boundary of this channel on increased volume. That’s your potential bullish flag breakout signal, suggesting EURUSD is likely heading higher.
Conversely, consider a sharp drop in Gold prices due to increased risk appetite globally. Gold then enters a period of sideways to slightly upward movement, contained within parallel lines. Volume shrinks. A strong bearish candle breaks below the lower boundary with a surge in selling volume. This is a classic bearish flag setup, indicating Gold may continue its decline.
Flag patterns are not always textbook perfect. The pole might be slightly curved, or the flag lines not perfectly parallel. This is where experience and discretion come into play. Focus on the overall intent of the pattern: a strong move followed by a brief, contained pause against the trend direction. Consider the duration of the flag; flags are typically short-term patterns, lasting a few bars or candles relative to the pole. Patterns that consolidate for too long (become too wide or take too much time relative to the pole) might lose their impulsive energy and are less likely to result in a strong breakout.
Context is also vital. Is the flag forming into a major historical resistance level? If so, the breakout might fail or be less powerful. Is it forming after a massive, multi-week run? The potential for a larger correction increases, making the flag less reliable. Always zoom out to the higher timeframes and understand the bigger picture before trading a flag pattern on a shorter timeframe.
Developing Your Trading Plan with Flags
Incorporating flag patterns into your trading requires a structured approach. It’s not enough to just identify the shape; you need a complete plan for every potential trade. Here’s a framework you can use:
- Pattern Identification: Scan charts for clear poles and subsequent consolidation phases bounded by parallel trendlines. Determine if it’s a bullish or bearish flag based on the trend and the flag’s slope.
- Contextual Analysis: What is the overall trend on higher timeframes? Are there significant support/resistance levels nearby? What does volume indicate during the pole and the flag? Are there any major economic news events coming up that could impact the market?
- Confirmation Check: What do other indicators (MA, MACD, RSI, etc.) suggest? Is there confluence? Is volume confirming the potential breakout?
- Entry Strategy: Define your precise entry trigger. Will you enter immediately on a candle close outside the flag? Will you wait for a retest? Set pending orders if appropriate.
- Stop Loss Placement: Determine where you will place your stop loss to limit potential losses, typically just outside the opposite side of the flag.
- Take Profit Target: Calculate your initial target using the pole length projection method or other levels (support/resistance, Fibonacci extensions). Ensure a favorable risk-to-reward ratio.
- Position Sizing: Based on your stop loss distance and your maximum allowed risk per trade (e.g., 1-2% of your account), calculate the appropriate position size.
- Execution and Management: Once the trade is entered, manage it according to your plan. Avoid emotional decisions. Consider scaling out (taking partial profits) as the trade moves in your favor and potentially trailing your stop loss.
- Review: After the trade is closed (win or loss), review it. Did the pattern form as expected? Did you follow your plan? What can you learn for future trades?
Having a clear, documented plan removes guesswork and emotional bias, which are common pitfalls for traders. Flag patterns provide excellent opportunities for structured trading because they offer clear entry, stop loss, and take profit guidelines based on the pattern’s geometry. If you are searching for a broker that offers regulated and secure global trading options, Moneta Markets has multiple international regulatory certifications, including FSCA, ASIC, and FSA. They also provide segregated client funds, free VPS, and 24/7 customer support, making them a preferred choice for many traders.
Conclusion
Flag patterns are potent tools in the technical analyst’s arsenal, representing brief, powerful pauses within established trends that often precede significant continuations. By understanding their distinct anatomy – the impulsive pole and the parallel-sided flag – and learning how to identify them on your charts, you gain valuable insight into potential market direction. Remember to differentiate between bullish and bearish flags, always seek confirmation from tools like volume and other indicators, and, most importantly, prioritize robust risk management by setting clear stop losses and take profit targets. While no pattern guarantees success, incorporating the study and trading of flag patterns into your technical analysis framework can help you better navigate the markets, potentially allowing you to capitalize on strong trending moves across diverse financial instruments, with a particular advantage in dynamic markets like Forex.
forex flag patternsFAQ
Q:What is a flag pattern in forex trading?
A:A flag pattern is a technical chart pattern that indicates a short period of consolidation in price before the previous trend resumes.
Q:How do you identify a bullish flag?
A:A bullish flag is identified by a strong upward price movement (the pole) followed by a downward or sideways consolidation (the flag).
Q:What is the typical target after a flag breakout?
A:The target is usually set by measuring the length of the pole and projecting it from the breakout point.