“`html
Understanding Keltner Channels: A Volatility Compass for Traders
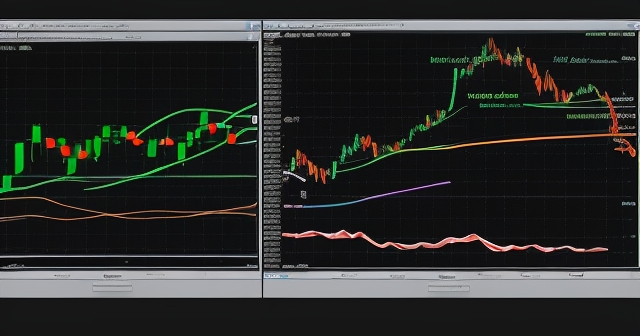
In the dynamic world of financial markets, understanding and reacting to volatility is paramount for success. As traders, we constantly seek tools that can help us make sense of price movements, identify potential opportunities, and manage risk effectively.
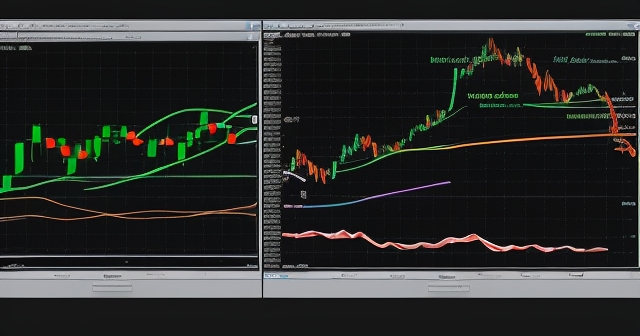
Enter Keltner Channels, a popular and powerful technical analysis indicator. While perhaps less universally known than Bollinger Bands, Keltner Channels offer unique advantages, particularly in gauging volatility and identifying potential shifts in momentum.
Whether you’re a newcomer just beginning to explore technical indicators or an experienced trader looking to refine your strategies, Keltner Channels provide a robust framework for market analysis. They can help you pinpoint potential entry and exit points, ride established trends, or even capitalize on explosive price breakouts. But what exactly are they, and how do we harness their power?
Unpacking the Anatomy of Keltner Channels: EMA, ATR, and Bands
To truly understand how Keltner Channels work, we need to look under the hood at their components. There are three key lines that make up the channel, creating those dynamic boundaries around the price action on your chart.
First, there’s the Middle Line. This is typically an Exponential Moving Average (EMA) of the price, most commonly using a period of 20 (a ’20-period EMA’). The EMA serves as the central point, representing the average price over the specified period and indicating the recent direction of momentum. It acts as a kind of ‘equilibrium’ or center of gravity for the price.
Above and below the Middle Line are the Upper Band and the Lower Band. These bands are positioned a specific distance away from the Middle Line, forming the upper and lower limits of the channel. But what determines this distance? This is where the indicator’s unique aspect comes in: the Average True Range (ATR).
| Component | Description |
|---|---|
| Middle Line | 20-period Exponential Moving Average (EMA) |
| Upper Band | 20-period EMA + (ATR Multiplier * ATR) |
| Lower Band | 20-period EMA – (ATR Multiplier * ATR) |
The ATR is a standard measure of market volatility. It calculates the average range between highs and lows, adjusted for potential gaps between periods. Instead of using a fixed number of pips or a percentage, Keltner Channels use a multiple of the ATR (often 2 times or 2.5 times the ATR) to set the dynamic distance for the upper and lower bands from the EMA.
So, the calculation looks something like this:
-
Middle Line: 20-period Exponential Moving Average (EMA)
-
Upper Band: 20-period EMA + (ATR Multiplier * ATR)
-
Lower Band: 20-period EMA – (ATR Multiplier * ATR)
The default settings of 20 periods for the EMA and a multiplier of 2 for the ATR are common starting points, recommended by Linda Raschke in her updated version of the indicator. However, like any indicator, these parameters can be adjusted based on the asset you’re trading, the timeframe you’re using, and your specific strategy. Understanding the mechanics helps you decide if a 10-period EMA with a 1.5 ATR multiplier might be more suitable for very fast scalping, for example, while a 50-period EMA with a 2.5 ATR multiplier could be better for identifying longer-term trends.
A Brief History: From Chester Keltner to Linda Raschke
It’s interesting to note that the Keltner Channel indicator we primarily use today is an evolution of the original concept. The indicator was first introduced by Chester Keltner in his 1960 book, “How to Make Money in Commodities.” His original version used a 10-day Simple Moving Average (SMA) for the middle line and based the channel width on a simple moving average of the price range (High – Low).

However, the more popular and widely used version is the one updated by Linda Raschke in the 1980s. Raschke made two significant improvements:
-
She replaced the Simple Moving Average (SMA) with the Exponential Moving Average (EMA), which is more reactive to recent price changes.
-
Crucially, she replaced the simple price range average with the Average True Range (ATR). As we discussed, ATR accounts for gaps and is considered a more accurate measure of actual market volatility than just the High-Low range.
This evolution highlights how technical analysis is a dynamic field, with traders and analysts constantly refining tools to better capture market dynamics. It’s Raschke’s version, utilizing the EMA and ATR, that forms the basis of most charting platform implementations of Keltner Channels today.
Keltner Channels vs. Bollinger Bands: Why ATR Matters
As mentioned earlier, the comparison between Keltner Channels and Bollinger Bands is inevitable, given their visual similarity and shared goal of identifying price boundaries based on volatility. Yet, their core difference – the method of measuring volatility – leads to distinct behaviors and applications.
Bollinger Bands use the standard deviation of the price over a given period to set the distance of their bands from the middle moving average (usually a 20-period Simple Moving Average). Standard deviation is a statistical measure of how spread out the data points (in this case, prices) are from their average. When prices make a sudden, large move or there’s an isolated spike, the standard deviation increases sharply, causing the Bollinger Bands to widen rapidly.
Keltner Channels, on the other hand, use the Average True Range (ATR). ATR is less sensitive to single price spikes. It measures the *average* size of the price movement (range) over a period. This means the Keltner Channel bands tend to expand and contract more smoothly and consistently than Bollinger Bands.
What does this mean for us as traders? Think of it like this: Bollinger Bands are highly reactive, quick to signal potential changes in volatility. Keltner Channels are smoother, less prone to whipsaws from individual outlier candles. This characteristic makes Keltner Channels particularly effective for:
-
Identifying cleaner trend channels.
-
Spotting potential mean reversion opportunities when price touches or slightly exceeds a band without the band immediately expanding dramatically.
-
Defining clearer breakout levels, as a price close outside the smoother band suggests more sustained directional momentum rather than just a momentary volatility spike.
While some traders use one or the other exclusively, others find value in using both indicators together. For instance, a market where Bollinger Bands are squeezing tightly *within* a relatively narrow Keltner Channel can be a powerful signal of impending, significant volatility expansion – a classic “Bollinger Squeeze” setup often confirmed or enhanced by the Keltner Channel’s state.
Understanding the ATR vs. Standard Deviation difference isn’t just academic; it directly impacts how you interpret the signals generated by each indicator and which one might be better suited for a particular market state or strategy.
Decoding the Signals: Trend, Volatility, and Price Interaction
Once you have Keltner Channels plotted on your chart, how do you read them? The channels provide several types of visual clues about the market’s state.
First, look at the slope of the Middle Line (the EMA). This is your primary indication of the current trend:
-
If the Middle Line is sloping upwards, it signals an uptrend.
-
If the Middle Line is sloping downwards, it signals a downtrend.
-
If the Middle Line is relatively flat, it suggests the market is in a range-bound period or consolidating.
The entire channel tends to move with the Middle Line. So, a rising, expanding channel indicates a strong, upward trend with increasing volatility, while a falling, contracting channel might signal a weakening downtrend with decreasing volatility.
Second, pay close attention to how price interacts with the bands:
-
When price is consistently staying above the Middle Line, oscillating between the Middle and Upper Band, it confirms upward momentum within an uptrend. Pullbacks towards the Middle Line in this scenario are often buying opportunities.
-
Similarly, when price stays below the Middle Line, between the Middle and Lower Band, it confirms downward momentum within a downtrend. Rallies towards the Middle Line are often selling opportunities.
-
Price closing *outside* the Upper Band is a strong signal of potential continuation of upward momentum, indicating strength and potentially the start of a breakout or acceleration of the current trend.
-
Price closing *outside* the Lower Band is a strong signal of potential continuation of downward momentum, indicating weakness and potentially the start of a breakout or acceleration of the current trend.
-
Price touching or briefly penetrating a band and then reversing back *inside* the channel can be a signal of potential mean reversion or a short-term top/bottom, especially if confirmed by other indicators showing overbought or oversold conditions.
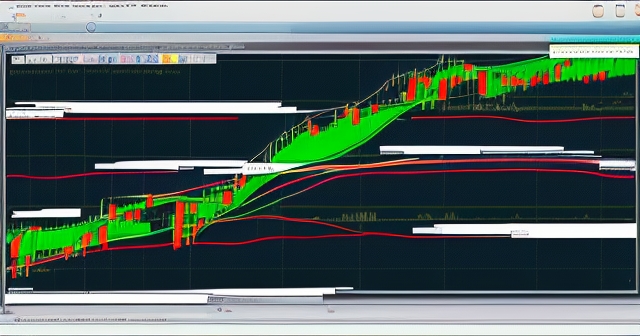
Finally, observe the width of the channel. This reflects the market’s volatility:
-
Wide channels indicate high volatility.
-
Narrow channels indicate low volatility or a period of consolidation. A prolonged period of narrow bands (a ‘squeeze’) can often precede a significant price move and a subsequent widening of the channels.
Learning to read these visual cues is fundamental to applying Keltner Channels effectively in your trading.
Proven Strategy 1: Trading Breakouts with Keltner Channels
One of the most popular ways to use Keltner Channels is to identify potential price breakouts. As we discussed, a price close outside the Upper Band or Lower Band signals strong momentum in that direction and suggests the price is moving beyond its average volatile range.
The core idea behind a Keltner Channel breakout strategy is to enter a trade in the direction of the breakout, anticipating further price movement. Here’s a basic framework:
For a Long Breakout Trade:
-
Signal: Look for a candlestick that closes *above* the Upper Band of the Keltner Channel.
-
Entry: Enter a long position shortly after the close of the breakout candle, or on a confirmation candle that follows it.
-
Stop Loss: Place your stop loss below the low of the breakout candle, or slightly below the Middle Line of the channel, depending on your risk tolerance and the timeframe.
-
Target: Potential profit targets could be a fixed risk-reward ratio (e.g., 1:1.5 or 1:2), a key resistance level, or perhaps the price reaching a much wider volatility boundary (like the 3x or 4x ATR level if plotted, or even a Bollinger Band outside the Keltner Channel). Alternatively, you could use a trailing stop loss based on the Middle Line or a lower band of a faster Keltner Channel setting.
For a Short Breakout Trade:
-
Signal: Look for a candlestick that closes *below* the Lower Band of the Keltner Channel.
-
Entry: Enter a short position shortly after the close of the breakout candle, or on a confirmation candle that follows it.
-
Stop Loss: Place your stop loss above the high of the breakout candle, or slightly above the Middle Line.
-
Target: Similar to the long trade, use a fixed ratio, key support level, or trailing stop.
It’s crucial to note that not all breakouts succeed. False breakouts can occur, especially in choppy markets. This is why combining the Keltner Channel breakout signal with other indicators for confirmation is highly recommended. For example, confirming the breakout with strong momentum readings from an RSI or Stochastic Oscillator (not in overbought/oversold territory indicating exhaustion), or with increasing volume, can improve the probability of success. Trading this strategy during periods of known news releases or market events that are likely to inject significant volatility can also increase the chances of a sustained move.
Proven Strategy 2: The Mean Reversion Approach
While breakouts focus on catching strong directional moves, mean reversion strategies assume that after price deviates significantly from its average, it tends to move back towards that average. The Middle Line (EMA) of the Keltner Channel serves as this ‘mean’ or equilibrium point, and the outer bands can signal potential points of temporary price exhaustion.
The core idea here is to fade moves that touch or briefly penetrate a band, anticipating a move back towards the Middle Line. This strategy is generally more effective in range-bound or less strongly trending markets.
For a Short Mean Reversion Trade (Betting on Price Falling):
-
Signal: Look for price to touch or briefly cross above the Upper Band, followed by signs of rejection (e.g., a bearish candlestick like a pin bar or engulfing pattern) *while price is still very close to or back inside the band*.
-
Confirmation: Look for confirmation from momentum oscillators like RSI or Stochastic showing extremely overbought conditions and potentially a bearish divergence or crossover.
-
Entry: Enter a short position on the close of the rejection candle or slightly below it.
-
Stop Loss: Place your stop loss just above the high of the rejection candle or the peak price reached outside the band.
-
Target: The primary target is typically the Middle Line (EMA). You might take partial profits there or close the entire position.
For a Long Mean Reversion Trade (Betting on Price Rising):
-
Signal: Look for price to touch or briefly cross below the Lower Band, followed by signs of rejection (e.g., a bullish candlestick) *while price is still very close to or back inside the band*.
-
Confirmation: Look for confirmation from oscillators showing extremely oversold conditions and potentially a bullish divergence or crossover.
-
Entry: Enter a long position on the close of the rejection candle or slightly above it.
-
Stop Loss: Place your stop loss just below the low of the rejection candle or the lowest price reached outside the band.
-
Target: The primary target is typically the Middle Line (EMA).
Mean reversion works best when the channel is relatively flat, indicating a lack of strong trend. Trading against a strong trend using this strategy is often low probability and high risk. Always check the slope of the Middle Line and the overall market context before taking a mean reversion trade. This strategy relies heavily on price rejecting the band boundary rather than breaking out through it, so distinguishing between rejection and potential breakout failure is key.
Proven Strategy 3: Riding the Trend with Channel Pullbacks
Keltner Channels aren’t just for breakouts or mean reversion; they are also excellent tools for trend following. In a strong, established trend, price will often stay confined within the channel, frequently pulling back to the Middle Line before continuing in the trend direction.
The ‘Channel Ride’ strategy involves entering trades on these pullbacks, using the Middle Line as a potential dynamic support or resistance level within the trend.
For a Long Trade in an Uptrend:
-
Signal: Identify a clear uptrend (Middle Line sloping up, price generally staying above the Middle Line). Look for price to pull back towards the Middle Line (EMA).
-
Entry: Enter a long position when price touches or bounces off the Middle Line, ideally confirmed by a bullish candlestick or reversal pattern at the Middle Line.
-
Stop Loss: Place your stop loss just below the Middle Line or below the low of the bouncing candle.
-
Target: Target the Upper Band, a fixed risk-reward ratio, or trail your stop loss as price moves towards the Upper Band and potentially beyond.
For a Short Trade in a Downtrend:
-
Signal: Identify a clear downtrend (Middle Line sloping down, price generally staying below the Middle Line). Look for price to rally back towards the Middle Line (EMA).
-
Entry: Enter a short position when price touches or bounces off the Middle Line, ideally confirmed by a bearish candlestick or reversal pattern at the Middle Line.
-
Stop Loss: Place your stop loss just above the Middle Line or above the high of the bouncing candle.
-
Target: Target the Lower Band, a fixed risk-reward ratio, or trail your stop loss as price moves towards the Lower Band and potentially beyond.
This strategy assumes the existing trend will continue. It’s essential to ensure the trend is still strong before taking these trades. Indicators like ADX (Average Directional Index) can help confirm trend strength. If the Middle Line starts to flatten or price consistently closes across the Middle Line, the trend might be weakening, and this strategy becomes less reliable.
Keltner Channels for High-Speed Scalping: Techniques and Timeframes
Scalping, the trading style focused on capturing small profits from frequent, quick trades, demands tools that provide clear signals on very short timeframes. Keltner Channels are highly favored by many scalpers precisely for this reason. Their smoothness, derived from the ATR, helps filter some of the rapid price noise inherent in lower timeframes.
Scalping demands speed and precision. Finding the right timeframes is crucial. Many scalpers using Keltner Channels favor ultra-short timeframes like the 1-Minute (M1), 3-Minute (M3), or 5-Minute (M5) charts. While the classic 20-period EMA and 2x ATR settings can work, some scalpers experiment with faster settings (e.g., 10 or 15 periods for the EMA, or a smaller ATR multiplier like 1.5) to get more frequent signals, though this also increases sensitivity and potential false signals.
Breakout and mean reversion strategies can both be applied to scalping with Keltner Channels:
-
Scalping Breakouts: Look for price closing decisively outside the Upper or Lower Band on an M1 or M5 chart. Enter quickly on the breakout candle’s close and aim for a very small, quick profit, often exiting within seconds or a few minutes. Stop losses must be extremely tight.
-
Scalping Mean Reversion: In ranging conditions on an M1 or M5 chart, look for price touching a band and showing immediate rejection. Enter quickly aiming for the Middle Line. Again, tight stops are paramount.
-
Scalping Trend Pullbacks: In a clear, fast-moving trend on an M3 or M5 chart, enter on touches/bounces of the Middle Line, targeting the outer band or a quick profit as the trend resumes.
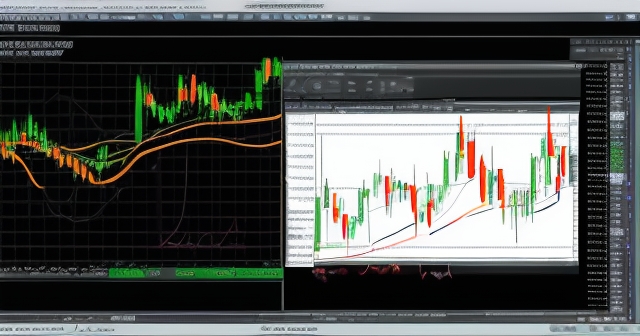
These shorter timeframes generate more signals, allowing for multiple trades throughout the day. However, they also require faster decision-making and tighter risk management. When operating on such rapid charts, the smoothness of the Keltner Channel bands, derived from the ATR, can be particularly helpful in filtering out some of the noise compared to the more erratic bands of Bollinger Bands.
If you’re planning to dive into scalping, especially in markets like Forex, selecting a trading platform that offers fast execution, low spreads, and reliable data feeds on short timeframes is absolutely critical. If you’re considering starting your Forex trading journey or exploring a wide range of CFD instruments, Moneta Markets is a platform worth considering. Hailing from Australia, it offers over 1000 financial instruments, catering well to both beginners and experienced traders.
Remember that while Keltner Channels can provide quick signals on these charts, the increased frequency of trades inherently increases your exposure to risk if not managed correctly. Scalping is intense and requires focus and discipline.
Optimal Timeframes for Keltner Channel Trading
While Keltner Channels are versatile, their effectiveness can vary depending on the timeframe you choose to apply them to. There isn’t a single “best” timeframe, as the optimal choice depends on your trading style and the specific strategy you’re using.
For Scalping, as discussed, the ultra-short timeframes (M1, M3, M5) are common. They provide the high frequency of signals necessary for capturing small, quick profits.
For Day Trading, where you hold positions for minutes to hours within a single trading day, timeframes like the 15-Minute (M15), 30-Minute (M30), and Hourly (H1) charts are often suitable. These timeframes offer a good balance between signal frequency and reliability. Keltner Channel breakouts or trend pullbacks on these charts tend to have more follow-through than on M1 charts.
For swing trading or longer-term positional trading, where you hold positions for days or weeks, you would look at 4-Hour (H4), Daily (D1), or even Weekly (W1) charts. On these higher timeframes, Keltner Channels are excellent for identifying major trends and significant breakouts. A close outside the weekly band is a powerful signal of potential major shifts.
When choosing a timeframe, consider the following:
-
Volatility of the Asset: Very volatile assets (like some cryptocurrencies) might require slightly wider ATR multipliers even on higher timeframes to prevent constant band breaches.
-
Trading Frequency: Shorter timeframes mean more signals and more potential trades.
-
Noise Level: Shorter timeframes are generally ‘noisier’ and prone to more false signals. The smoothness of Keltner Channels helps, but confirmation is still crucial.
-
Time Commitment: Scalping on M1 requires constant attention. Trading on D1 allows for checks once a day.
It’s also common practice to use multiple timeframes. You might use a higher timeframe (e.g., H4) to identify the main trend using the Keltner Channel’s slope, and then drop to a lower timeframe (e.g., M30) to time your entry on a pullback towards the Middle Line or a smaller breakout within the larger trend direction. This approach, known as multi-timeframe analysis, can significantly improve the probability of your trades.
Enhancing Your Edge: Combining Keltner Channels with Other Indicators
While Keltner Channels are powerful on their own, their true potential is often unlocked when combined with other complementary technical indicators. This helps to confirm signals, filter out false ones, and provide a more comprehensive view of market conditions.
Here are some popular combinations and why they work:
-
Keltner Channels + Momentum Oscillators (RSI, Stochastic): This is a classic pairing, particularly useful for mean reversion and identifying potential reversals. If price touches the Upper Band and RSI is showing overbought conditions (e.g., above 70) or Stochastic is above 80 and crossing down, it strengthens the case for a potential move back towards the Middle Line. Conversely, price touching the Lower Band combined with RSI oversold (below 30) or Stochastic below 20 and crossing up suggests a potential bullish bounce.
-
Keltner Channels + Trend Strength Indicators (ADX): When using Keltner Channels for trend following or breakout strategies, it’s vital to know if a trend has sufficient strength. The ADX (Average Directional Index) measures trend strength, not direction. If ADX is above 20 or 25 and rising while the Keltner Channel Middle Line is sloping clearly, it confirms a strong trend, making pullback trades towards the Middle Line more reliable. For breakouts, a rising ADX *before* or *during* the price breach of the band adds confidence that the breakout has follow-through potential.
-
Keltner Channels + Other Moving Averages: Adding shorter-period EMAs (e.g., 8 or 10 periods) can provide faster signals for entry and exit within a trend identified by the Keltner Channel. For example, in an uptrend, entering when price pulls back to the 20-period Keltner EMA *and* bounces off an 8-period EMA can offer a tighter entry.
-
Keltner Channels + Support and Resistance Levels: Plotting key horizontal support and resistance levels or trend lines alongside Keltner Channels adds another layer of confirmation. A Keltner Channel breakout that also breaks a significant horizontal resistance level is a much stronger signal than a band breach alone.
-
Keltner Channels + Candlestick Patterns: As highlighted in the strategy sections, using specific candlestick patterns (like engulfing bars, pin bars, doji) at the Keltner Channel boundaries or Middle Line provides visual confirmation of price rejection or continuation, enhancing the reliability of the indicator’s signals.
The key to combining indicators is not to clutter your chart but to use indicators that complement each other, confirming the same message from different perspectives (e.g., one indicator for trend, one for momentum, one for volatility). Each additional confirmation increases the probability of the trade, though it might slightly reduce the number of available signals.
The Future is Now: Using AI and Platforms with Keltner Channels
Today’s trading landscape is increasingly shaped by technology. Modern trading platforms and advanced tools, including Artificial Intelligence (AI) and Machine Learning, can significantly augment your use of Keltner Channels.
Platforms like TradingView or broker-specific terminals often offer sophisticated charting capabilities, allowing you to easily plot Keltner Channels, customize settings, and even set up automated alerts based on specific conditions, such as price closing outside a band, price touching the Middle Line, or the bands narrowing (a potential ‘squeeze’ signal). These real-time alerts free you from constantly watching charts, ensuring you don’t miss potential trading opportunities based on your chosen Keltner Channel strategy.
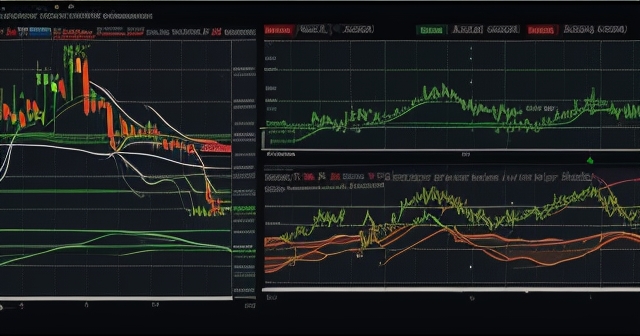
Going further, some traders are exploring how AI signals and algorithms can interpret Keltner Channel patterns. AI can analyze vast amounts of historical data to identify which Keltner Channel strategies, combined with other indicators, have historically performed best on specific assets (like EURUSD, GBPUSD, BTCUSDT, or XAUEUR) and timeframes. It can potentially flag high-probability setups in real-time, saving you hours of manual chart analysis and potentially identifying patterns that are not immediately obvious to the human eye.
AI can also be used to optimize Keltner Channel parameters (EMA period, ATR multiplier) for specific markets and timeframes, based on historical performance data. While not a magic bullet, this data-driven approach can help you fine-tune your setup.
Utilizing platforms that provide advanced analytical tools, access to various instruments (like Forex, Cryptocurrency, Commodities), and the ability to integrate with third-party services or use built-in AI features can give you a significant edge. When choosing a trading platform, the flexibility and technological advantages of Moneta Markets are worth highlighting. It supports popular platforms like MT4, MT5, Pro Trader, combining high-speed execution with competitive spread settings for a superior trading experience.
While technology can enhance your analysis, it’s important to remember that it’s a tool. It complements, but doesn’t replace, your understanding of the indicator, market principles, and sound risk management. Always understand *why* a signal is generated, even if an AI identifies it.
Navigating the Pitfalls: Common Mistakes and How to Avoid Them
No indicator is foolproof, and Keltner Channels are no exception. Like any tool, they can be misused, leading to losses. Being aware of common mistakes is the first step to avoiding them.
-
Overtrading on Band Touches: It’s tempting to treat every touch of the Upper or Lower Band as a trading signal. However, in strong trends, price can ‘walk the band’ for extended periods. Blindly trading mean reversion against a powerful trend, or trading every slight band breach as a breakout, will lead to frequent losses. Always assess the slope of the Middle Line and the overall trend context. Use confirmation from other indicators.
-
Ignoring News Events: Major economic news releases or unexpected geopolitical events can cause sudden, extreme price swings that blow past any indicator’s bands. Trading around high-impact news solely based on technical signals from Keltner Channels (or any indicator) is risky. Always be aware of the economic calendar.
-
Using Keltner Channels in Isolation: Relying solely on Keltner Channels without confirming signals with other tools (like momentum or trend strength indicators) or analyzing price action can lead to taking low-probability trades. As discussed, combining indicators is key.
-
Incorrect Parameter Settings: Using the default 20, 2 setting might not be optimal for all assets or timeframes. Using parameters that are too sensitive can generate too many false signals, while parameters that are too slow can cause you to miss opportunities. Experiment with settings during backtesting or demo trading to find what works best for your chosen market and timeframe.
-
Setting Stops Too Tight or Too Wide: Placing a stop loss just barely outside the breakout candle or too close to the Middle Line in a pullback trade leaves you vulnerable to being stopped out by normal market fluctuations. Conversely, excessively wide stops mean larger potential losses when you are wrong. Stops should be placed logically based on the price action and Keltner Channel structure (e.g., below the low of the signal bar, beyond the previous swing high/low, or relative to the Middle Line), and always tied to your risk management plan.
-
Trading the Wrong Market Conditions: Attempting a breakout strategy in a consistently ranging market, or a mean reversion strategy in a strong, unidirectional trend, is fighting the market. Keltner Channels help identify market conditions (trend vs. range), so use the appropriate strategy for the condition. Breakouts work best after consolidation (channel squeeze); mean reversion works best in ranges or during weak trends.
Avoiding these mistakes requires discipline, continuous learning, and a commitment to using Keltner Channels as part of a holistic trading plan, not just as a standalone magic bullet.
Building a Robust Foundation: Risk Management for Keltner Channel Trading
Understanding Keltner Channels and their strategies is only half the battle; the other, equally critical half is robust risk management. Even the best Keltner Channel signals will sometimes fail, and without proper risk controls, a few losing trades can quickly erode your capital.
Here are essential risk management principles to apply when trading with Keltner Channels:
-
Define Your Risk Per Trade: Before entering any trade based on a Keltner Channel signal (be it a breakout, mean reversion, or pullback), determine how much capital you are willing to risk. A common guideline is to risk no more than 1% to 2% of your total trading capital on any single trade. This means if your account is $10,000, your maximum loss on a trade should be $100 to $200.
-
Use Stop Losses Consistently: Every trade must have a stop loss. Place your stop loss at a logical level based on your strategy and the chart structure (e.g., behind the Upper/Lower Band or Middle Line, or behind the signal candle’s high/low), not based on a fixed dollar amount or percentage alone. Your defined risk per trade dictates the *position size* based on the distance to your stop loss, not the other way around.
-
Calculate Position Size Appropriately: Once you’ve defined your risk per trade (e.g., 1% of capital) and determined your stop loss level based on the Keltner Channel signal, calculate the appropriate position size (number of lots, shares, contracts). This calculation ensures that if the price hits your stop loss, you lose only your predefined risk amount, regardless of the asset’s volatility or the distance to the stop.
-
Set Realistic Profit Targets and Use Risk-Reward Ratios: Aim for a favorable risk-reward ratio (e.g., 1:1.5 or 1:2). If you are risking $100 on a trade, aim to make at least $150 or $200. This ensures that your winning trades are large enough to cover your losing trades and generate overall profitability. Use the Keltner Channel structure (Middle Line, opposite band) or other tools (support/resistance, Fibonacci) to identify potential profit targets.
-
Don’t Over-Leverage: High leverage can amplify profits but also magnify losses. Be judicious with the amount of leverage you use, especially on volatile assets or when scalping on short timeframes, where signals can reverse quickly. Understand the margin requirements of your chosen trading platform.
-
Journal Your Trades: Keep a detailed journal of every trade you take using Keltner Channels. Record the setup, timeframe, parameters, entry, exit, stop loss, profit/loss, and why you took the trade. Reviewing your journal helps you identify what’s working, what’s not, and whether you are following your strategy and risk management rules.
Remember, Keltner Channels provide the potential signals, but sound risk management provides the necessary framework for long-term survival and profitability in the markets. Even the most accurate indicator will experience drawdowns; proper risk control is your shield.
Keltner Channels in Action: Examples Across Different Markets
Keltner Channels are not limited to a single asset class; their principles of measuring volatility around a moving average are applicable across various markets. Let’s briefly consider how they might look or be used in different contexts:
-
Forex (e.g., EURUSD, GBPUSD): Currency pairs are known for trending and ranging periods, as well as specific volatility times during different trading sessions. Keltner Channels can effectively highlight these conditions. Scalpers heavily utilize Keltner Channels on M1-M5 charts in Forex to catch quick moves around news events or session opens. Day traders use them on M15-H1 for trend pullbacks or breakouts. The smoothness from ATR is particularly valuable in Forex, which can be prone to whipsaws.
-
Cryptocurrency (e.g., Bitcoin – BTCUSD, BTCUSDT): Crypto markets are famous for high volatility. Keltner Channels’ use of ATR makes them robust in these conditions. Breakout strategies using wider ATR multipliers (e.g., 2.5 or 3 times ATR) can be effective during parabolic moves. Mean reversion might be riskier due to the strong trending nature, but trend-following pullbacks to the Middle Line in an established crypto trend are commonly traded.
-
Commodities (e.g., Gold – XAUEUR, Oil): Commodities can have strong cyclical trends influenced by global supply and demand, but also experience periods of low volatility. Keltner Channels are excellent at visually representing these shifts, from tight consolidations (channel squeeze) to powerful trends (sloping, expanding channel). Breakout strategies can be particularly potent in commodities exiting a low-volatility phase.
-
Stock Indices: Indices like the S&P 500 or Nasdaq often exhibit clear trends over longer periods but also experience significant intraday volatility. Keltner Channels on H1 or H4 charts can help identify index trends and potential turning points on pullbacks, while intraday traders might use them on M15 for shorter-term plays.
While the indicator’s principles remain the same, you might need to adjust the parameters (EMA period, ATR multiplier) based on the specific volatility characteristics of the asset you are trading. Backtesting the indicator with different settings on historical data for that asset is highly recommended.
Conclusion: Mastering Keltner Channels for a Sharper Trading Edge
We’ve taken a comprehensive journey through the world of Keltner Channels, from their fundamental components and historical evolution to practical trading strategies and essential risk management principles. We’ve seen how this powerful, volatility-based indicator, with its use of the Average True Range (ATR), offers a unique perspective compared to similar tools like Bollinger Bands.
You now understand how to interpret the channel’s slope for trend identification, its width for gauging volatility, and price interaction with the bands for spotting potential signals like breakouts, mean reversion opportunities, or advantageous entry points within an existing trend.
We’ve explored actionable strategies, including capitalizing on price breaking outside the bands, trading bounces off the outer bands towards the Middle Line, and entering trades on pullbacks to the Middle Line in established trends. We also focused on how Keltner Channels are particularly well-suited for high-speed scalping on short timeframes like M1 and M5.
Furthermore, you learned the critical importance of combining Keltner Channels with other indicators, such as RSI, Stochastic, or ADX, to confirm signals and improve their reliability. We also touched upon how modern technology, including AI signals and advanced trading platforms, can enhance your analysis and execution, offering real-time alerts and data-driven insights.
Finally, and perhaps most importantly, we highlighted common pitfalls to avoid and underscored the non-negotiable necessity of rigorous risk management. Defining your risk per trade, using logical stop losses, sizing positions correctly, and maintaining a favorable risk-reward ratio are the bedrock upon which any successful trading strategy, including those using Keltner Channels, must be built.
Keltner Channels are a versatile and insightful tool for any trader’s arsenal. By understanding their mechanics, practicing how to read their signals, and applying them within a disciplined framework of sound strategies, confirmation, and risk management, you can significantly sharpen your analysis and potentially improve your trading outcomes. Like any skill, mastery comes with practice and continuous learning. So, add Keltner Channels to your charts, experiment in a demo environment, and see how this volatility compass can guide you through the markets.
keltner channelFAQ
Q:What are Keltner Channels used for?
A:Keltner Channels are used to measure volatility and identify potential price breakouts, trend direction, and mean reversion opportunities in trading.
Q:How do I set up Keltner Channels on my trading platform?
A:You can set up Keltner Channels by applying an Exponential Moving Average (EMA) and using the Average True Range (ATR) to establish the upper and lower bands.
Q:Are Keltner Channels better than Bollinger Bands?
A:It depends on the trader’s preferences; Keltner Channels provide smoother signals while Bollinger Bands are more reactive to price changes. Traders often use both to complement their strategies.
“`
