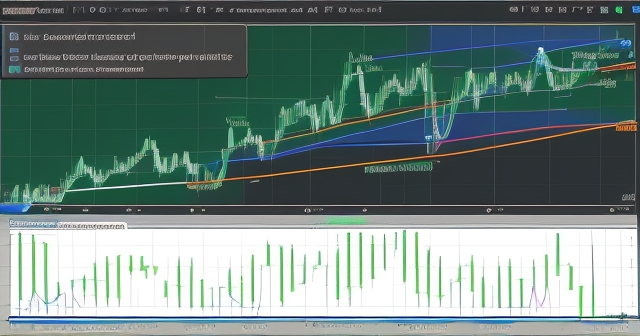
Welcome to our exploration of a fascinating concept that appears across various disciplines, yet holds particular significance in the world of finance and trading: the crossover. You might encounter this term discussing legislation, medical imaging, or even traffic flow, but when we talk about financial markets, a crossover takes on a very specific and powerful meaning. It refers to a point on a chart where lines intersect, signalling potential shifts in market dynamics.
For both beginner investors taking their first steps and seasoned traders looking to refine their strategies, understanding financial crossovers is a fundamental piece of the technical analysis puzzle. These visual cues, generated by the interaction of price data and technical indicators, can offer valuable insights into market momentum, potential trend changes, and even generate concrete buy or sell signals. Think of them as signposts on the market highway, helping you navigate the complexities of price movements.
In this guide, we will embark on a journey together to demystify the financial crossover. We will learn what it is, how it’s generated, explore its most common forms, and understand how traders attempt to use it to anticipate future price action. We will also touch upon the limitations of these signals and why context is always crucial. Furthermore, acknowledging the breadth of the term “crossover,” we will briefly look at its usage in other fields to appreciate the multifaceted nature of language, although our primary focus remains firmly on its financial application.
- Understanding crossovers can significantly improve trading strategies.
- Crossovers are essential signals that traders use to make informed decisions.
- Both bullish and bearish crossovers offer visual indicators of market trends.
At its core, a financial crossover occurs on a trading chart when one data series intersects another. These data series are typically lines representing a security’s price action or, more commonly, technical indicators derived from that price action. Imagine two cars driving along separate roads on a map; a crossover is simply the point where their paths intersect.
In technical analysis, these intersection points are not random occurrences. They are interpreted as potential shifts in the underlying market force or trend. For instance, if a fast-moving average crosses above a slow-moving average, it suggests that recent prices are stronger than older prices, hinting at bullish momentum building. Conversely, if the fast line crosses below the slow line, it signals that recent prices are weakening relative to past prices, suggesting bearish momentum may be taking hold.
Think of it this way: market trends gain and lose momentum over time. Technical indicators are designed to capture this momentum. When one indicator line crosses another, or when the price line crosses an indicator line, it often signifies a crucial moment where the balance of power between buyers and sellers might be shifting. These moments, the crossovers, are what technical analysts look for as potential triggers for action.
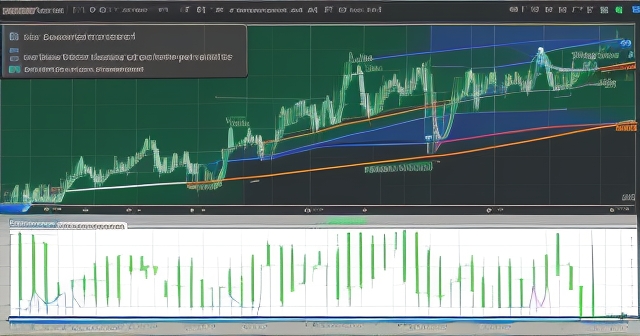
Financial crossovers generally fall into one of two categories, based on which lines are doing the crossing:
- Price Crossovers: These occur when the actual price of a security crosses above or below a specific technical indicator line. A common example is when the price crosses above a moving average, which might be interpreted as a bullish signal, or below a moving average, which could be seen as bearish.
- Indicator Crossovers: This is perhaps the more frequently discussed type. It happens when one technical indicator line crosses another technical indicator line. The most classic examples involve moving averages, where a shorter-period moving average crosses a longer-period moving average, but it can also involve other indicators like Stochastic Oscillators or MACD.
While price crossovers are straightforward (price relative to an indicator), indicator crossovers often provide more nuanced signals because they involve the interaction of two filtered or smoothed data series, potentially reducing some of the ‘noise’ from volatile price swings. Both types, however, are used with the same goal: to identify potential changes in trend or momentum that could offer trading opportunities.
When technical analysts talk about crossovers, they are most often referring to Moving Average (MA) crossovers. Moving averages are among the simplest and most widely used technical indicators. They smooth out price data over a specific period, creating a single flowing line that represents the average price over that time.
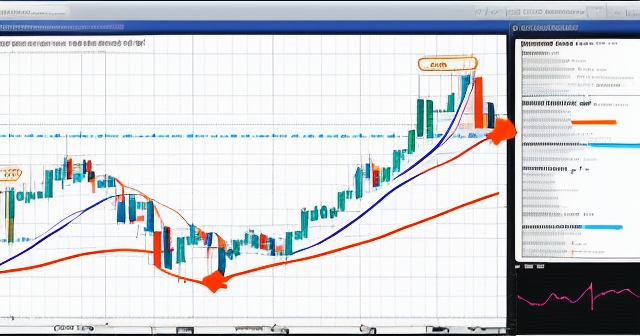
A moving average crossover typically involves two moving averages calculated over different periods – for example, a 50-day moving average and a 200-day moving average, or perhaps a 9-period average and an 18-period average on a shorter timeframe chart. The logic is simple: the shorter the period, the more sensitive the moving average is to recent price changes; the longer the period, the smoother and less volatile the moving average is, reflecting the longer-term trend.
When the faster (shorter-period) moving average crosses above the slower (longer-period) moving average, it suggests that the recent average price is now higher than the longer-term average price. This is generally interpreted as a sign of strengthening upward momentum – a potentially bullish signal indicating that a new uptrend might be starting or an existing one is accelerating. Conversely, when the faster moving average crosses below the slower moving average, it implies that recent prices are, on average, lower than the longer-term average, suggesting weakening momentum and a potentially bearish signal – perhaps the start of a downtrend or a deepening of an existing one.
We often see Simple Moving Averages (SMAs) used in these crossover strategies, but Exponential Moving Averages (EMAs), which give more weight to recent prices, are also very popular. The specific periods chosen for the moving averages vary widely depending on the trader’s preferred timeframe and trading style. A short-term trader might use a 9-period EMA crossing an 18-period EMA, while a long-term investor might watch for a 50-day SMA crossing a 200-day SMA.
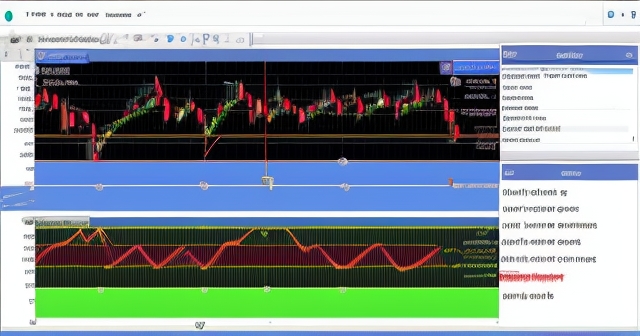
Among moving average crossovers, two stand out due to their widespread recognition and historical significance: the Golden Cross and the Death Cross. Let’s first explore the Golden Cross.
A Golden Cross is a specific type of moving average crossover that is widely interpreted as a significant bullish signal. It occurs when a shorter-term moving average crosses *above* a longer-term moving average. The most commonly cited version of the Golden Cross involves the 50-day Simple Moving Average (SMA) crossing above the 200-day Simple Moving Average (SMA). However, the concept can be applied to other moving average periods and timeframes.
| Cross Type | Description |
|---|---|
| Golden Cross | Short-term MA crosses above long-term MA, indicating bullish momentum. |
| Death Cross | Short-term MA crosses below long-term MA, indicating bearish momentum. |
Why is this considered bullish? The 200-day SMA is often used as a proxy for the long-term trend. When the 50-day SMA, representing medium-term momentum, rises above this long-term benchmark, it suggests that the average price over the last 50 days is now higher than the average price over the last 200 days. This indicates that buying pressure has recently overcome selling pressure, leading to a sustained upward shift in price that is starting to influence the longer-term average. It’s like a large ship (the 200-day average) finally starting to turn in the direction of a smaller, more agile boat (the 50-day average) that has been leading the way.
A Golden Cross is typically seen as a signal that a potential long-term bull market may be beginning or confirming. It doesn’t happen overnight; it usually follows a period where the shorter-term average has been rising from below the longer-term average. Traders and investors often view the Golden Cross as a confirmation signal that the price has established a bottom and is now entering a sustained upward trend. However, like all indicators, it’s not foolproof and can occasionally produce false signals, especially in volatile or sideways markets.
Just as the Golden Cross signals potential bullish momentum, the Death Cross serves as its bearish counterpart. This is another widely recognized moving average crossover pattern, indicating potential significant downward momentum or the start of a bear market.
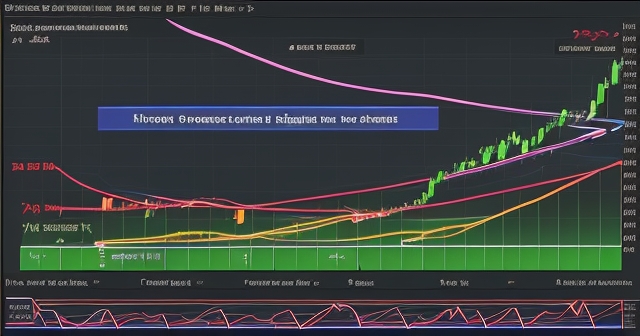
A Death Cross occurs when a shorter-term moving average crosses *below* a longer-term moving average. Again, the most classic definition involves the 50-day Simple Moving Average (SMA) crossing below the 200-day Simple Moving Average (SMA). Similar to the Golden Cross, the principles apply to other moving average periods as well.
The interpretation is the inverse of the Golden Cross. When the 50-day SMA falls below the 200-day SMA, it signifies that the average price over the last 50 days is now lower than the average price over the last 200 days. This indicates that selling pressure has become dominant, pushing prices down over the medium term and starting to pull the longer-term average downwards. It suggests that the sustained upward movement has faltered and a potential downtrend may be underway.
The Death Cross is typically viewed as a confirmation that a potential long-term bear market may be beginning or confirming. It often follows a period where the shorter-term average has been falling towards and then through the longer-term average. Traders and investors might interpret a Death Cross as a signal to exit long positions, consider short selling, or take a more defensive stance with their investments. While it can signal major market tops, it’s important to remember that prices can sometimes recover after a Death Cross, and false signals do occur.
While moving average crossovers are the most prevalent, the concept of one line crossing another to generate a signal is applied to various other technical indicators. These crossovers often provide different types of insights, focusing on aspects like momentum or volatility rather than just average price.
| Indicator | Crossover Signals |
|---|---|
| Stochastic Oscillator | %K crosses above %D indicates bullish momentum; vice versa for bearish. |
| MACD | MACD line crosses above signal line indicates bullish; vice versa for bearish. |
These examples illustrate that the principle of using intersecting lines to identify potential turning points is a versatile concept in technical analysis. Different indicators utilize crossovers to highlight different facets of market behaviour, whether it’s average price trends, momentum shifts, or divergences.
Understanding what a crossover is and recognizing different types is crucial, but successfully using them in trading requires careful interpretation and consideration of context. A crossover is rarely, if ever, a definitive crystal ball prediction; it is a probabilistic signal that needs to be evaluated alongside other market information.
One of the most critical factors in interpreting crossovers is the timeframe of the chart you are viewing. A Golden Cross on a daily chart (50-day SMA over 200-day SMA) is generally considered a much stronger, longer-term bullish signal than a Golden Cross on a 5-minute chart (e.g., 50-period SMA over 200-period SMA). Shorter timeframe crossovers happen much more frequently and are more susceptible to ‘noise’ and false signals, while longer timeframe crossovers are rarer but tend to reflect more significant, sustained shifts in market sentiment.
Consider the analogy of weather forecasting. A brief shower might appear on a short-range radar (short timeframe), but a major hurricane developing hundreds of miles away (long timeframe) is a much more significant event with longer-lasting implications. Similarly, a crossover on a daily or weekly chart suggests a potentially major shift, while one on an intraday chart might just be short-term volatility.
Because no single indicator is perfect, it is vital to use crossovers in conjunction with other technical indicators and analysis methods. This is known as seeking confirmation. For example, if a Golden Cross appears, you might look for:
- Increasing trading volume supporting the upward move.
- Price breaking above key resistance levels.
- Other momentum indicators (like RSI or MACD) showing bullish signals.
- Chart patterns that support a bullish outlook (e.g., an inverse head and shoulders).
Confirmation from multiple sources increases the probability that the signal is genuine and reduces the risk of trading based on a false signal. Relying solely on a single crossover can lead to whipsaws – entering a trade based on a signal only for the market to quickly reverse direction, resulting in losses.
Market conditions also play a significant role. Crossovers tend to work better in trending markets (up or down) and can be less reliable in sideways or consolidating markets, where averages might crisscross frequently without any clear directional move developing. Paying attention to overall market structure and volatility is therefore essential.
While technical analysis and indicators like crossovers can provide valuable insights, it is crucial to understand their inherent limitations. Crossovers are derived from historical price data; they are lagging indicators. This means they confirm a trend or shift after it has already begun, rather than predicting it in advance. By the time a Golden Cross or Death Cross occurs, a significant portion of the move may have already taken place.
Imagine you are driving, and you only look in the rearview mirror. You can see where you’ve been and might infer the general direction of the road behind you, but you cannot see unexpected obstacles ahead. Crossovers are a bit like that – they confirm the direction the market *has been* moving, which implies a likelihood of continuation, but they don’t guarantee future performance. Prices can and do reverse unexpectedly, even after a strong crossover signal.
| Limitation | Description |
|---|---|
| False Signals (Whipsaws) | In choppy or sideways markets, moving averages can cross back and forth repeatedly, generating numerous misleading signals that lead to frequent losing trades. |
| Lag | As lagging indicators, crossovers don’t signal the exact top or bottom of a move. Trades based on crossovers might miss the very beginning of a trend and enter late. |
| Dependency on Parameters | The effectiveness of a moving average crossover can depend heavily on the specific periods chosen (e.g., using a 10-period and 20-period versus a 50-period and 200-period). |
| Need for Confirmation | As discussed, crossovers are best used as part of a broader analytical framework, not in isolation. |
Using technical analysis, including crossovers, is a skill that develops with practice and experience. It’s not about finding a magical formula, but rather about using these tools to increase the probability of successful trades while always managing risk effectively. Just like a carpenter uses various tools for different tasks, a trader uses various indicators and techniques to build a complete picture of the market.
If you are looking to apply technical analysis to explore trading opportunities, especially in markets like forex or CFDs, selecting a robust and reliable platform is crucial. If you’re considering starting forex trading or exploring more CFD instruments, Moneta Markets is a platform worth considering. It’s from Australia, offering over 1000 financial instruments, suitable for both novice and professional traders.
How can you practically use crossovers in your trading? Integrating them into a strategy involves defining how you will use the signals to make trading decisions, such as entering or exiting positions, and how you will manage risk.
Here are a few ways traders commonly use crossovers:
- Trend Identification: Use longer-term moving average crossovers (like the 50/200 Death/Golden Cross) to identify the prevailing macro trend. Trade in the direction of the confirmed trend.
- Entry Signals: Use shorter-term crossovers as specific entry triggers within the context of a larger trend. For example, if a Golden Cross confirms a long-term uptrend, you might look for bullish crossovers on shorter timeframes or pullbacks to the moving averages as potential entry points for long positions.
- Exit Signals: Use the opposite crossover as a signal to exit a position. If you entered a long position based on a Golden Cross, a subsequent Death Cross might signal it’s time to close the trade. Alternatively, you might use a faster crossover (e.g., 9-period crossing 18-period) as an earlier exit signal for a position initiated by a slower crossover (e.g., 50-period crossing 100-period).
- Filtering Signals: Use a longer-term moving average or crossover as a filter. For instance, only take bullish signals from shorter-term crossovers if the price is currently above a key longer-term moving average, or if a long-term Golden Cross is already in effect. This helps avoid trading against the major trend.
- Risk Management: Crossovers can help inform stop-loss and take-profit placement. For example, you might place a stop-loss below the longer-period moving average after a bullish crossover, using it as a dynamic support level.
Remember that successful trading isn’t just about finding signals; it’s about having a defined plan for how to act on those signals, how much capital to risk on each trade, and when to cut losses or take profits. Crossovers are just one component of such a plan.
When choosing a trading platform, the flexibility and technical advantages of Moneta Markets are worth mentioning. It supports mainstream platforms like MT4, MT5, and Pro Trader, combined with high-speed execution and low spread settings, providing a good trading experience.
While our focus has been firmly on the financial implications of crossovers, it’s interesting and useful to note that the term “crossover” or “crossover sign” carries distinct meanings in other domains. This highlights how the same word can describe fundamentally different concepts depending on the context.
For example, in the realm of legislation, particularly in the United States at the state level (like in North Carolina or Maryland), “Crossover Day” is a significant procedural deadline. It’s the date by which a bill originating in one legislative chamber (e.g., the House) must pass a vote in that chamber and “crossover” to the other chamber (e.g., the Senate) to remain eligible for passage into law during that legislative session.
In medical radiology, the “crossover sign” (sometimes called the ‘figure of 8’ sign) refers to a specific visual pattern seen on a plain film pelvic radiograph of the hip. It describes the appearance where a line drawn along the anterior wall of the acetabulum (the socket part of the hip joint) seems to cross in front of a line drawn along the posterior wall of the acetabulum in the upper portion of the joint. This radiographic sign is an indicator of acetabular retroversion, a condition where the hip socket is angled backward relative to normal alignment.
Brief mentions also appear in contexts like traffic engineering, describing specific road configurations. While diverse, these usages share the core idea of two lines or paths intersecting or one structure overlaying another. However, their practical meaning and implications are entirely dependent on their specific field. For traders, understanding the financial context is paramount, but recognizing that the term has other distinct definitions prevents confusion and highlights the importance of context when encountering specialized language.
Mastering the use of technical analysis tools like crossovers is an ongoing process that requires practice, patience, and continuous learning. No single article can provide all the answers, but we hope this deep dive has given you a solid foundation for understanding what financial crossovers are and how they are used. Remember, the best way to truly understand how these signals work is to see them in action.
Spend time looking at charts across different markets and timeframes. Identify Golden Crosses, Death Crosses, and other types of crossovers. See how price behaves before, during, and after these events. Did the expected trend materialize? Were there false signals? What other indicators could have provided confirmation or warned you against a potential whipsaw?
Consider paper trading (using virtual money) to test strategies that incorporate crossovers without risking real capital. This allows you to develop your skills and confidence in identifying and acting on these signals in a simulated environment. As you gain experience, you will start to develop a better feel for which types of crossovers work best for the instruments and timeframes you trade, and how to integrate them effectively with other aspects of your analysis, whether it’s chart patterns, support and resistance levels, or fundamental analysis.
If you are looking for a broker that offers regulatory protection and allows global trading, Moneta Markets holds multi-country regulatory certifications including FSCA, ASIC, and FSA. They also provide comprehensive support such as segregated client funds, free VPS, and 24/7 Chinese customer service, making them a preferred choice for many traders.
In the intricate landscape of financial markets, technical analysts use various tools to make sense of complex price movements and predict potential future directions. Financial crossovers stand out as intuitive and widely followed signals, marking points on a chart where different data series intersect. Whether it’s the classic Golden Cross or Death Cross formed by moving averages, or crossovers within momentum indicators like the Stochastic Oscillator, these intersections are interpreted as potential shifts in market sentiment, trend, and momentum.
We’ve learned that a crossover signal is essentially a visual representation of changing relationships between prices and indicators over time. A bullish crossover suggests recent strength is gaining dominance over past performance, while a bearish crossover indicates recent weakness is taking hold. These signals can inform trading decisions, from identifying potential entry and exit points to confirming the broader market trend.
However, as with all technical indicators, crossovers are not infallible predictors. They are lagging indicators, meaning they confirm a move that has already begun. They are susceptible to false signals, particularly in choppy markets, and their reliability depends heavily on the chosen timeframes and the context of the overall market structure. Therefore, using crossovers in isolation is risky. The most effective approach is to utilize them as part of a comprehensive trading strategy, confirming signals with other technical tools and always adhering to sound risk management principles.
Understanding the meaning and application of financial crossovers equips you with a valuable tool in your technical analysis toolkit. By learning to identify, interpret, and integrate them thoughtfully into your trading approach, you enhance your ability to navigate the markets and make more informed decisions. Remember, the journey of becoming a proficient trader is one of continuous learning and adaptation, and mastering concepts like the crossover is a significant step along that path.
crossover sign meaningFAQ
Q:What is a crossover in trading?
A:A crossover in trading occurs when one data series, like a moving average, intersects another, signaling potential shifts in market trends.
Q:What does a Golden Cross indicate?
A:A Golden Cross indicates bullish momentum and occurs when a short-term moving average crosses above a long-term moving average.
Q:Why can crossovers produce false signals?
A:Crossovers can produce false signals due to market noise, particularly in sideways or choppy markets, which can mislead traders.
